Oceania
To which language should you translate to localize in Australia?
What we know from our community
“Whilst Australia has no official national language, English has been adopted as the de facto national language since European settlement. When the British literally shipped their convicts from Britain to Australia, the amalgamation of many different British dialects and accents came together to create “Australian English” and the Australian accent the world knows today.
It makes sense then, that Australian English is closer to British English in spelling and pronunciation than American English. For example, Australian English uses the “ou” spelling in words such as “colour” and “favour”; the “re” spelling in words such as “centre” and “litre”; and a double “l” in words such as “travelling” and “cancelled”. Australian English also uses the “-ise” spelling opposed to the “-ize” spelling of American English.
Date formats are also significantly different with Australian English using the DD/MM/YYYY (day, month, year) format opposed to the MM/DD/YYYY (month, day, year) of the American English system.
Australian English is also known worldwide for its interesting and colorful colloquialisms. Australians refer to the “countryside” as the “outback” or the “bush”; “g’day” is used as a simple everyday greeting, and many words are often shortened with an “ie” or “y”, for example “barbie” for “BBQ” and “footy” for “football”.”
What the 150 top websites do
Of the top 150 website (Global by design ranking):
- 143/150 translate into English.
- 1/150 translate into Simplified Chinese.
If you need others information, below you can find a selection of economic/social/cultural data
Overview
Language
Main language
English
It’s the only language spoken in the home for close to 72.7% of the population.
Other languages:
Mandarin (2.5%) and Arabic (1.4%).
T-index
1.5%
T-Index ranks countries according to their potential for online sales.
Indigenous languages
Australian Aboriginal languages, Tasmanian languages, Torres Strait Island languages.
Demography
Capital: Canberra
Currency: Australian dollar
Population: 26,05 mln (2022)
Population density: 3/km2 (2021)
Economy
GDP: 1,692,956.65 billion USD (2022)
GDP per capita: 65,099.8 USD (2020)
Exports: $424 billion (2022)
Statistics
Internet users: 94.9% penetration, 25.21 million
Unemployment rate: 3.7% (2022)
Urbanisation: 86% (2022)
Literacy: 99% (2024)
Conventions
Numbering system
Arabic numerals with dot as decimal separator, comma as thousands separator.
Date format: dd-mm-yyyy
Time: 12h time system (a.m/p.m)
Country code: 0061
Language data sources: Worldatlas/Britannica//EF/Wikipedia; Demography data sources: IMF/Worldometers; Conventions data source: Wikipedia; Economy data sources: WTO/OEC/CIA/Esomar/Datareportal; Statistics data sources: Datareportal/WorldBank/UN/UNESCO/CEIC/IMF/Culturalatlas/Commisceoglobal
Facts and data
Economy
Imports
$292 billion (2022). Refined Petroleum ($37.7B), Cars ($20.8B), Delivery Trucks ($8.59B), Broadcasting Equipment ($7.46B), and Computers ($7.03B), importing mostly from China ($81.2B), United States ($29.7B), South Korea ($18.7B), Japan ($16.7B), and Singapore ($14.7B).
In 2022, Australia was the world’s biggest importer of Sodium or Potassium Peroxides ($1.39B).
Financial inclusion factors (over 15 years of age)
• 100% have an account with a financial institution
• 59.7% have a credit card
• 76% make online purchases
Ease of doing business
It is very easy to conduct business (rated 81.2 out of 100) ranked 14th out of 34 OECD and high income countries, ranked 24th out of 190 countries worldwide (2023, World Bank).
Exports
$424 billion (2022). Coal Briquettes ($109B), Iron Ore ($87.9B), Petroleum Gas ($67.3B), Gold ($17.8B), and Wheat ($10.2B), exporting mostly to China ($123B), Japan($80.1B), South Korea ($41B), India ($31.5B), and Chinese Taipei ($24.1B).
In 2022, Australia was the world’s biggest exporter of Coal Briquettes ($109B), Iron Ore ($87.9B), Wheat ($10.2B), Other Mineral ($8.27B), and Aluminium Oxide ($6.29B).
Main local online stores
eBay, David Jones, Marks & Spencer, catch, Amazon Australia, Target.
Economic freedom
‘Free’ (76.2 out of 100) ranked 4th out of 39 Asia-Pacific countries ranked 13th out of 186 countries worldwide (2019, Heritage Foundation and Wall Street Journal).
Global Innovation Index
Ranked 6th out of 39 South-East, East Asia and Oceanian countries, 24th out of 132 worldwide.
The Global Innovation Index captures the innovation
ecosystem performance of 132 economies and tracks the most recent global innovation trends.
Economy data sources: WTO/OEC/CIA/Esomar/Datareportal
Trade balance of goods from 2012 to 2022
Source: Statista
Historical Data Trade Imports (2020)
The following section uses historical trade data imports from partners of Australia.
Historical Data Trade Exports (2020)
The following section uses historical trade data exports from partners of Australia.
Source: OEC
The Top Export Opportunities for Australia by Relatedness
Relatedness measures the distance between a country's current exports and each product by showing only products that Australia is not specialized in.
Australia's Most Complex Exports
The Product Complexity Index (PCI) measures the knowledge intensity of a product by considering the knowledge intensity of its exporters.
Source: OEC
Most Specialised Products by RCA Index
Specialisation is measured using Revealed Comparative Advantage, an index that takes the ratio between Australia observed and expected exports in each product
Source: OEC
Perception of products made in selected countries in 2017
Source: Statista
Which attributes do you associate with products made in Australia?
Source: Statista
Market Growth Imports (2020)
This score represents the likelihood that the given country will start importing that product in the next few years. It forecasts the opening of a new specific market.
Market Growth Exports (2020)
This score represents the likelihood that the given country will start exporting that product in the next few years. It forecasts the opening of a new specific market.
Source: OEC
Foreign direct investment, net inflows (% of GDP)
Source: WorldBank
What Australians shop for online
Source: Finder

T-index
Reach most of the online purchasing power
T-Index ranks countries according to their potential for online sales. It estimates the market share of each country in relation to global e-commerce.
Try it nowMedia
Media language
English
Information channels
Australia’s media scene is creatively, technologically and economically advanced. There is a tradition of public broadcasting, but privately-owned TV and radio have the biggest audiences.
The ownership of print and broadcast media is concentrated. Leading conglomerates include News Corp Australia, Seven West Media and the merged Fairfax Media-Nine Entertainment group.
The Australian Broadcasting Corporation (ABC) runs national and local public radio and TV.
The other main public broadcaster is the multilingual Special Broadcasting Service (SBS).
National commercial TV is dominated by three big free-to-air networks. Broadcasters must carry a minimum percentage of Australian-made programmes. Pay TV via cable, satellite and IPTV have a strong foothold.
Sports, news, game shows, imported and home-made dramas top the TV ratings.
The industry has successfully exported its productions to English-speaking markets overseas.
Media freedom watchdog Reporters Without Borders says tough defamation legislation, anti-terrorism laws and national security have reduced the space for “demanding investigative journalism”.
News agency
AAP – Australian Associated Press
ABC News – public broadcaster’s news site
news.com.au – news site owned by News Corp Australia
9News – news site run by Nine Network
The press
The Sydney Morning Herald – daily
Herald Sun – Melbourne-based daily
The Australian – national daily
The Daily Telegraph – Sydney-based daily
The Courier-Mail – Brisbane-based daily
The West Australian – Perth-based daily
The Age – Melbourne-based daily
The Advertiser – Adelaide-based daily
Australian Financial Review – business daily
Television
ABC – national, public
ABC News – ABC’s 24-hour news TV
SBS TV – public, multilingual
Seven Network – national, commercial
Nine Network – national, commercial
Network Ten – national, commercial
Sky News Australia – satellite/cable news network, owned by News Corp Australia
Foxtel – pay TV, owned by News Corp Australia and Telstra
Radio
ABC – public, operates speech-cultural network Radio National, ABC NewsRadio, youth network Triple J, ABC Classic FM and local services
Radio Australia – ABC external service, serves Asia-Pacific
SBS Radio-public, multilingual
Commercial Radio Australia – industry organisation
Media data source: BBC
Internet Data
Internet users
94.9% penetration, 25.51 million
Share of web traffic by device
41.84% mobile phones, 54.15% computers (laptops and desktops), 3.94% tablet devices and 0.07% other devices.
Median speed of mobile Internet connection
93.91 Mbps
Median speed of fixed Internet connection
54.41 Mbps
Mobile connection as a percentage of total population: 126.4%
Percentage of mobile connections that are broadband (3G-5G): 100%
Most popular web search engines
Google (93.57%), Bing (4.76%), Yahoo (0.73%), DuckduckGo (0.61%), Ecosia (0.12%), Yandex (0.1%).
Most used social media
Facebook (62.09%), Instagram (11.75%), Youtube (8.66%), Pinterest (7.66%), X (7.51%), reddit (1.14%).
Internet data sources: Datareportal/Statcounter
Social statistics
Life expectancy
83 yrs (2021)
Average age of the population
37.9 yrs (2020)
Glass Ceiling Index
63.2 out 100, ranked 16th out of 29 countries.
The glass-ceiling index measures the environment for working women combining data on higher education, labor-force participation, pay, child-care costs, maternity and paternity rights, business-school applications, and representation in senior jobs.
CO2 emissions
14.8 metric tons per capita (2020).
World Happiness Index
Australia ranked 38 out of 146 countries, with a score of 6.293.
Ethnicity
Australia is one of the most ethnically diverse societies in the world. Almost one in four Australian residents were born outside of Australia and many more are first or second generation Australians including children and grandchildren of recently arrived migrants and refugees. These wide varieties of backgrounds, together with the culture of Indigenous Australians who have lived on the continent for more than 50,000 years, have helped create a uniquely Australian identity and spirit. The general society is quite tolerant and embraces the diversity of its immigrants resulting in a myriad of accepted social values, mores and norms. The workplace reflects this melting pot and by and large is enhanced by the differing views and paradigms that coexist. Workplace diversity is embraced and encouraged, especially by large public and private sector organisations.
Urbanisation
86% (2022)
Unemployment rate
3.7% (2022)
Education expenditure:
92.3% of GDP.
Health expenditure:
10.65% of GDP (2020).
Corruption perceptions Index
Australia scored 75 out of 100, ranked 13 out 180 countries worldwide.
Religion
A century ago, ninety-six per cent of Australians identified as Christian and religion was a prominent factor of civic life. However, things have changed significantly since then. Although Christianity remains the dominant belief system in Australia, its civic voice has faded significantly. Extensive immigration has made Australia one of the most religiously diverse societies in the world. Almost all faiths are represented, with significant numbers of Muslims, Buddhists, Jews, and Hindus. Many indigenous Australians have embraced Christianity, often as a result of their contact with missionaries and missions. During the latter part of the 20th century religious diversity grew substantially, as did the number of people who do not profess any religion. The workplace accommodates this array of diversity within its Australian workforce.
Social statistics sources: WorldBank/UN/UNESCO/CEIC/IMF
Share of workers in Australia in 2019, by qualification level
Share of office locations for startup in Australia in 2018
Department of Employment; Australian Bureau of Statistics
Where it is hardest to afford home – Least affordable international housing markets ranked by house price to income ratio (2020)
Australian Bureau of Statistics
The Data Factbook is a work in progress project. Our community is helping us to fill it up always with new and updated data. Your contribution is precious. If you want to help us, please write your advices at imminent@translated.com
Languages research
Languages and dialects spoken in Australia
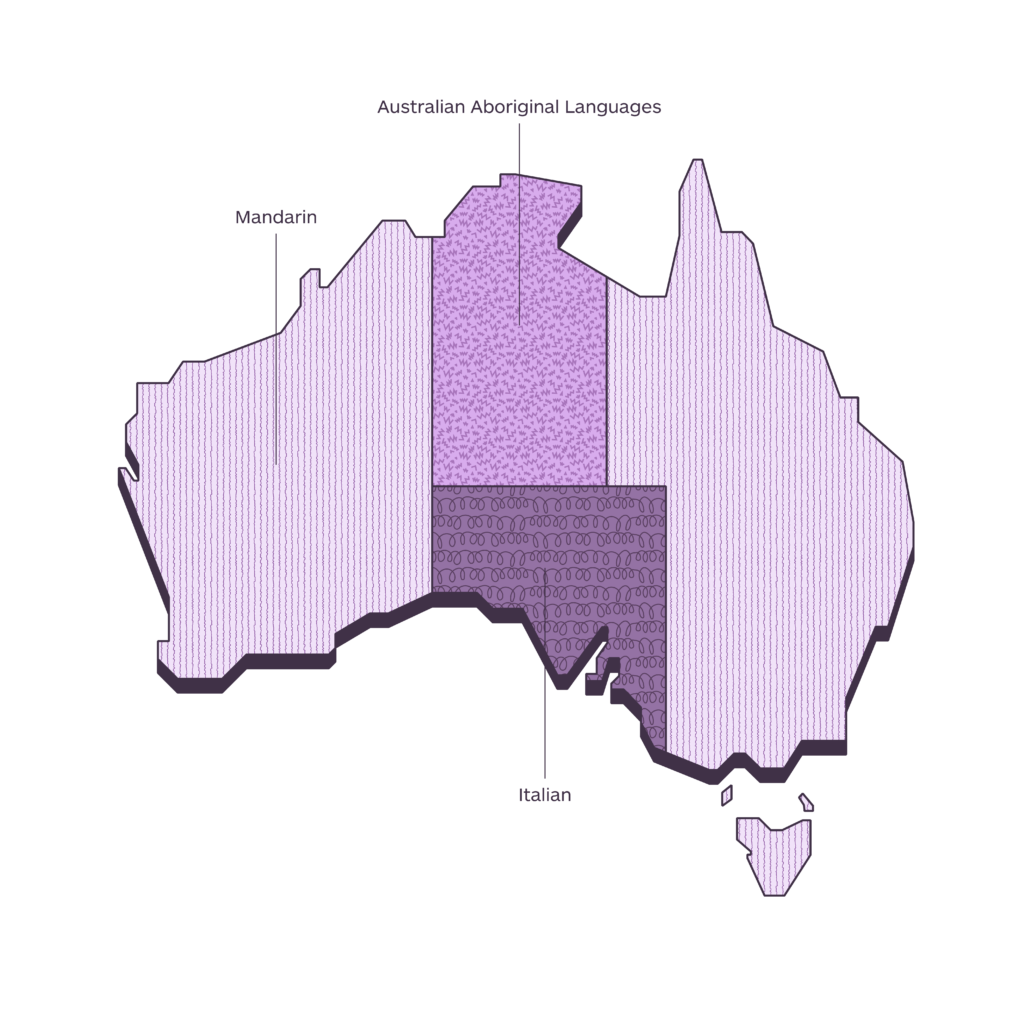
Legend
-
Mandarin
-
Italian
-
Australian Aboriginal Languages
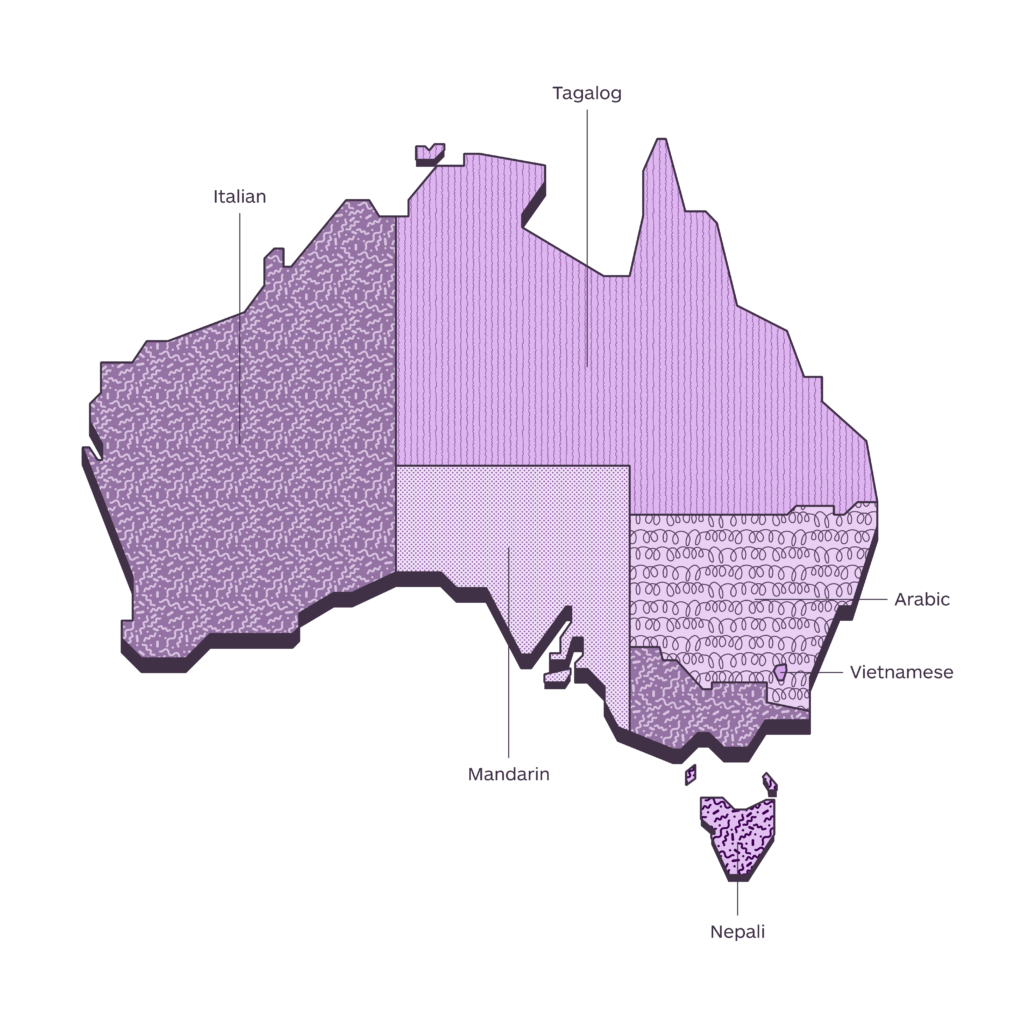
Legend
-
Arabic
-
Italian
-
Tagalog
-
Mandarin
-
Nepali
-
Vietnamese
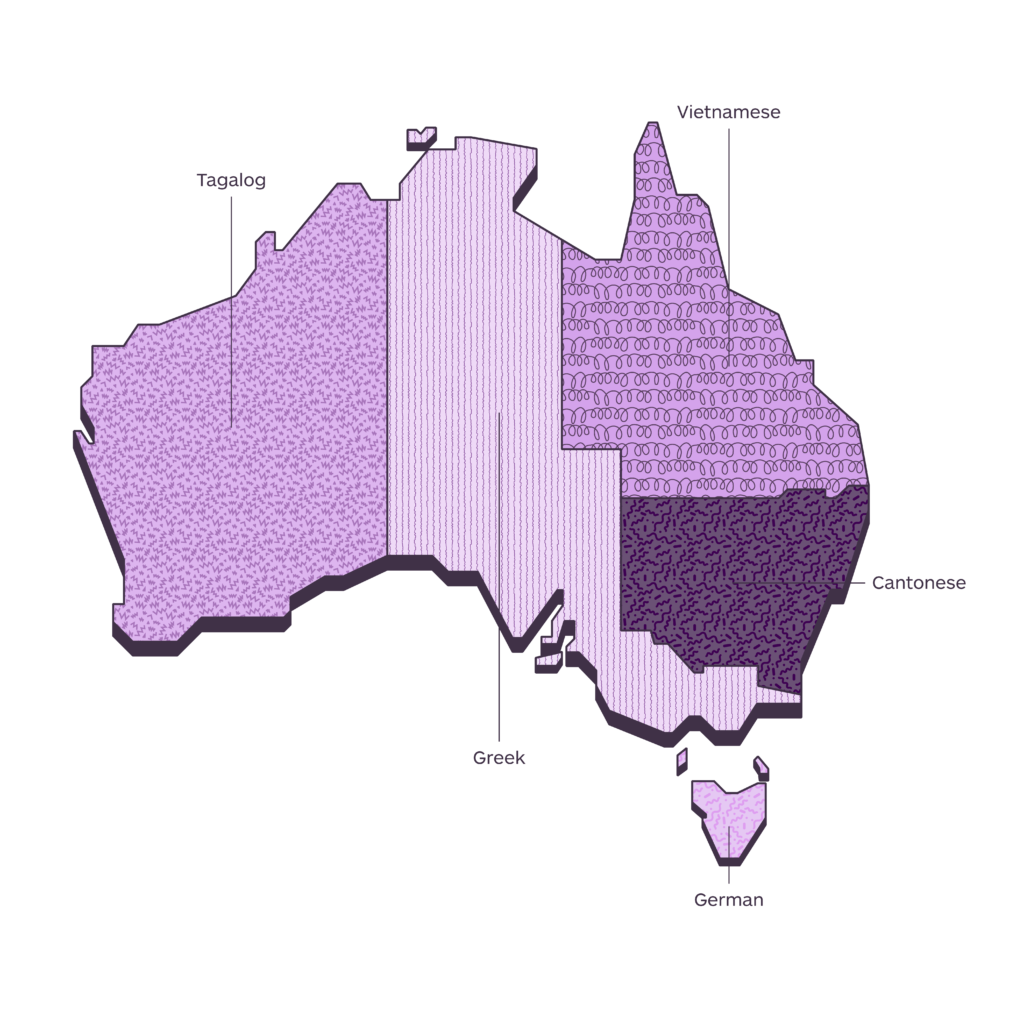
Legend
-
Greek
-
Vietnamese
-
Cantonese
-
Tagalog
-
German
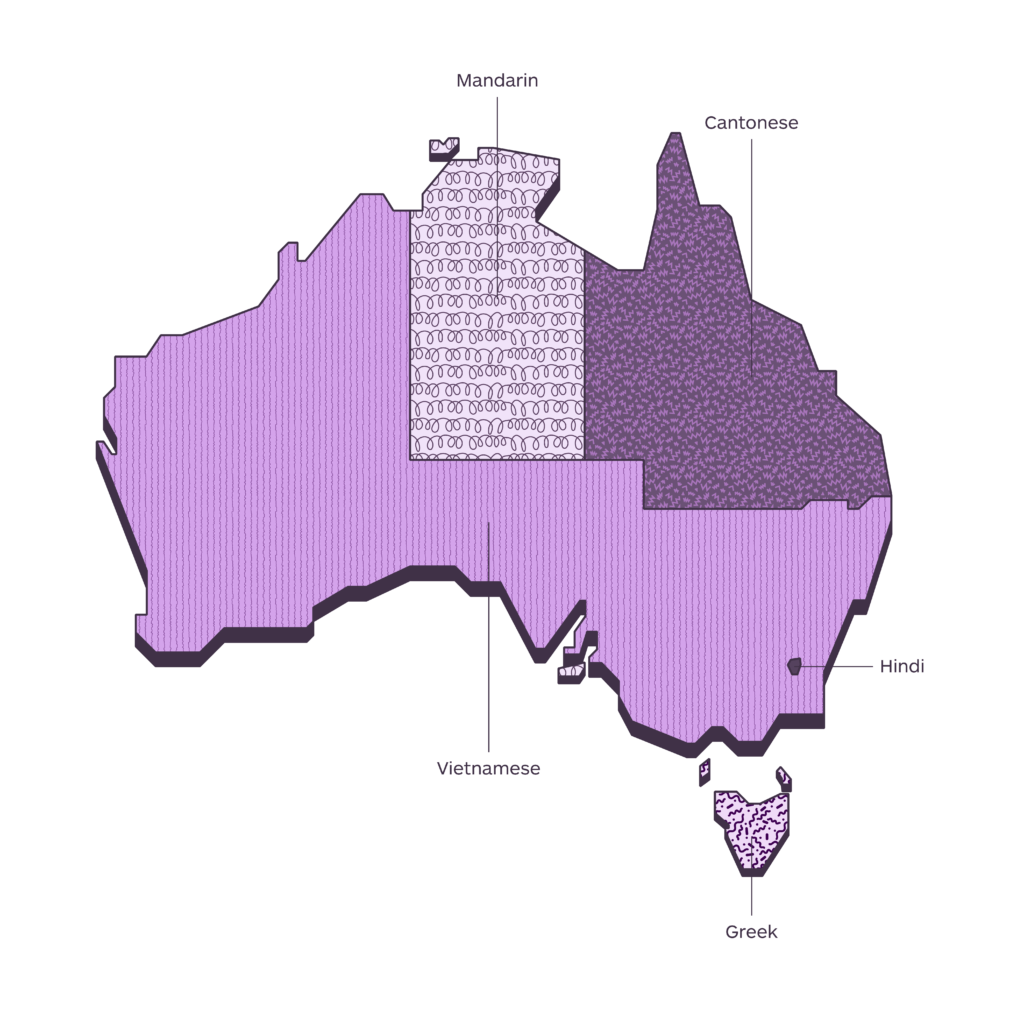
Legend
-
Vietnamese
-
Cantonese
-
Greek
-
Mandarin
-
Hindi
The geographical distribution of languages that you will find in the maps published in this section is a work in progress. Our community is helping us to fill it up with always new and updated data. Your contribution is precious. If you want to help us, please write to imminent.factbook@translated.com
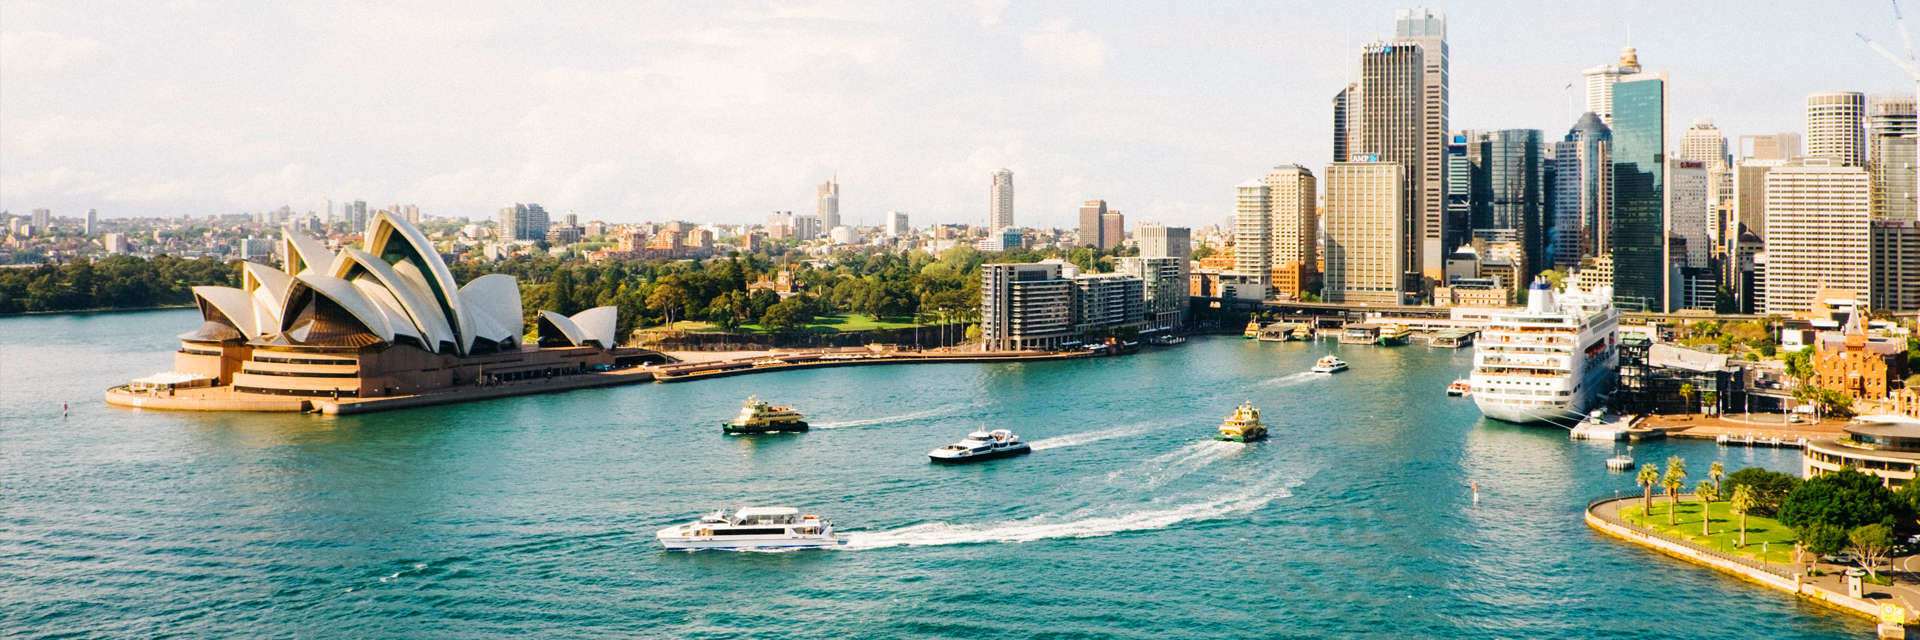
Photo credit: Dan Freeman, Unsplash
