North America
To which language should you translate to localize in Canada?
What we know from our community
Canada has two official federal languages, English and French, eight provinces in which English is the official language, one in which French is the official language, one province and one territory in which both French and English are official languages, and two territories with different mixes of English, French and Aboriginal languages (from the Dene, Inuit and Cree families) counted as official. To simplify.
In practice, almost everyone in Canada speaks one of the two federal official languages (and a bit under 80% as a mother tongue). A large majority of Canadian French speakers live in Québec, but they are present through Canada, with significant communities in Ontario and the Maritime provinces on the eastern coast (New Brunswick, Nova Scotia and Prince Edward Island). Most English speakers are not bilingual, and while a larger amount of French speakers are, localizing in Canada still means localizing in both languages. In fact, in some cases it’s illegal not to : the Charte de la langue française (Charter of the French language) mandates the use of French by businesses operating in the province of Québec (nearly a fourth of the population).
Canadian English is fairly close to American English, though it retains some elements of British spelling. We use localize like the Americans, but colour like the British. French Canadian has a more complicated relationship to its European variant, and the differences are strongly dependent on register. The differences are small in technical, academic or administrative contexts, but a natural, somewhat informal voice in Canada is very different from the same in France, from the use of pronouns like tu and on, to the use of anglicisms (and which anglicisms), to preferences in structure. In both cases, speakers will generally understand the variants, but they will notice the differences and those differences will grow more jarring the more a text has creative or marketing intent.
LANGUAGE INSIGHT
Official language
English (58.7%; 23.53 mln), French (22%; 8.8 mln).
Actual languages
English (58.7%; 23.53 mln), French (22.0%; 8.8 mln), Punjabi (1.4%; 561k), German (1.3%; 521k), Italian (1.3%; 521k), Spanish (1.3%; 521k), Chinese (1.2%; 481k), Tagalog (1.2%; 481k), Arabic (1.1%; 441k), Polish (0.7%; 280k), Portuguese (0.7%; 280k), Ukrainian (0.6%; 240k), Dutch (0.5%; 200k), Russian (0.4%; 160k), Inuit (0.1%; 40k), other (7.5%; 3 mln).
What the top 150 best localized websites in the world do in Canada
(Top 150 websites listed in the Global by Design ranking – published annually by Byte Level Research, this report provides a list of globally localized websites, showcasing best practices and emerging trends in their globalization)
- 131/150 localize by translating into both English and French
- 6/150 localize by translating into English
- 1/150 localizes by translating into both English and German
- 1/150 localizes by translating into English, French, German, Spanish, Italian and Simplified Chinese
- 1/150 localizes by translating into English, French, German, Spanish, Italian, Portuguese, Russian, Simplified Chinese, Traditional Chinese, Japanese and Korean
- 1/150 localizes by translating into English, French, German, Spanish, Italian, Portuguese, Simplified Chinese, Traditional Chinese, Japanese, Arabic, Czech, Hungarian, Nederland, Polish and Swedish
- 1/150 localizes by translating into English, French, German, Spanish, Italian, Portuguese, Russian, Simplified Chinese, Traditional Chinese, Japanese, Hungarian, Polish, Thai, Ukrainian, Turkish, Romanian and Bahasa Indonesia
- 1/150 localizes by translating into English, French and Simplified Chinese
- 1/150 localizes by translating into English, French, Simplified Chinese and Traditional Chinese
- 1/150 localizes by translating into English, Simplified Chinese and Traditional Chinese
-
 3M
3M
-
ABB
-
Accenture
-
Adidas
-
Adobe
-
Airbnb
-
Aldi
-
Amazon
-
American Airlines
-
American Express
-
Apple
-
Audi
-
Autodesk
-
Avis
-
Bayer
-
BMW
-
Booking.com
-
Bosch
-
British Airways
-
Bumble
-
Burberry
-
BYD
-
Canon
-
Capgemini
-
Cartier
-
Caterpillar
-
Chevrolet
-
Cisco Systems
-
Citibank
-
Coca-Cola
-
Costco
-
Dell
-
Deloitte
-
Delta
-
DHL
-
Disney+
-
Dyson
-
eBay
-
Eli Lilly
-
Emirates
-
Ernst & Young
-
Facebook
-
FedEx
-
Ford
-
Four Seasons
-
Fujifilm
-
GE
-
Gillette
-
GoDaddy
-
Google
-
Gucci
-
Haier
-
Heineken
-
Hermès
-
Hertz
-
Hilton
-
Hisense
-
Hitachi
-
Honda
-
Hotels.com
-
HP
-
HP Enterprise
-
HSBC
-
Huawei
-
Hyatt
-
Hyundai
-
IBM
-
IKEA
-
Intel
-
InterContinental Hotels
-
J&J
-
Jack Daniel's
-
Jehovah’s Witnesses
-
John Deere
-
Kellogg's
-
Kia
-
KPMG
-
L'Oréal
-
Land Rover
-
LEGO
-
Lenovo
-
Lexus
-
LG
-
Louis Vuitton
-
Lululemon
-
LUSH
-
Marriott
-
MasterCard
-
McDonald's
-
Mercedes-Benz
-
Merck
-
Microsoft
-
Mitsubishi Electric
-
Nestlé
-
Netflix
-
Nike
-
Nikon
-
Nintendo
-
Nio
-
Nissan
-
NIVEA
-
Oracle
-
Pampers
-
Panasonic
-
PayPal
-
Pepsi
-
Pfizer
-
Philips
-
Pitney Bowes
-
Porsche
-
Procter & Gamble
-
PWC
-
Revolut
-
Rolex
-
Royal Caribbean
-
Salesforce
-
Samsung
-
Sanofi
-
SAP
-
Sephora
-
Shopify
-
Siemens
-
Sony
-
Spotify
-
Starbucks
-
Steelcase
-
Stripe
-
Subaru
-
Tesla
-
The Church of Jesus Christ of Latter-day Saints
-
Tiffany
-
Tinder
-
Toshiba
-
Toyota
-
TripAdvisor
-
Uber
-
United Airlines
-
UPS
-
Visa
-
Volkswagen
-
Volvo Cars
-
Vrbo
-
Walmart
-
Western Union
-
Wikipedia
-
Wise
-
WordPress
-
Workday
-
Xerox
-
Xiaomi (Mi)
-
Zara
-
Zoom


If you need others information, below you can find a selection of economic/social/cultural data
Overview
Language
Official language
English (58.7%), French (22%).
Approximately 58.7% of the population of Canada speaks English as a native language, while 22% speak French as a first language. Additionally, 85.6% of the population is able to communicate in English and 30.1% are able to speak and understand French.
Other Languages
Punjabi (1.4%), German (1.3%), Italian (1.3%), Spanish (1.3%), Chinese (1.2%), Tagalog (1.2%), Arabic (1.1%), Polish (0.7%), Portuguese (0.7%), Ukrainian (0.6%), Dutch (0.5%), Russian (0.4%), Inuit (0.1%), other (7.5%).
T-index
2.2%
T-Index ranks countries according to their potential for online sales.
Demography
Capital: Ottawa
Currency: Canadian dollar
Population: 40.09 mln
Population density: 4.35/km2
Economy
GDP: 2.14 trillion USD (2023)
GDP per capita: 53,431.19 USD (2023)
Exports: $587 billion (2022)
Statistics
Internet users: 94.3% penetration, 36.74 million
Unemployment rate: 5.4% (2023)
Urbanisation: 82% (2023)
Literacy: 99% (2019)
Conventions
Numbering system
Arabic numbering system, point as decimal separator and comma as separator of thousands
Date format: yyyy-mm-dd / mm-dd-yyyy
Time: 12h time system (am/pm) – except Quebec (24h)
Country code: 001
Language data sources: Worldatlas/Britannica//EF/Wikipedia; Demography data sources: IMF/Worldometers; Conventions data source: Wikipedia; Economy data sources: WTO/OEC/CIA/Esomar/Datareportal; Statistics data sources: Datareportal/WorldBank/UN/UNESCO/CEIC/IMF/Culturalatlas/Commisceoglobal
Facts and data
Economy
Imports
$548 billion (2022). Cars ($31.9B), Refined Petroleum ($19.8B), Motor vehicles; parts and accessories (8701 to 8705) ($17.4B), Delivery Trucks ($17.3B), and Crude Petroleum ($16.8B), importing mostly from United States ($308B), China ($62.1B), Mexico ($22.2B), Germany ($14.1B), and Japan ($9.87B).
In 2022, Canada was the world’s biggest importer of Aluminium Oxide ($1.75B), Aqueous Paints ($663M), Carbon-based Electronics ($603M), Railway Freight Cars ($581M), and Iron Radiators ($564M).
Financial inclusion factors (over 15 years of age)
• 99.6% have an account with a financial institution
• 82.7% have a credit card
• 2.4% have a mobile money account
• 19% make online purchases
Ease of doing business
Very easy to conduct business (rated 79.6 out of 100). 14th out of 34 countries in the OECD and High-income group, 23rd worldwide out of 190 countries (2023, World Bank).
Exports
$587 billion (2022). Crude Petroleum ($123B), Cars ($29.4B), Petroleum Gas ($24.3B), Refined Petroleum ($17.2B), and Gold ($14.7B), exporting mostly to United States ($438B), China ($25.4B), Japan ($14.3B), United Kingdom ($12.9B), and Mexico ($7.39B).
In 2022, Canada was the world’s biggest exporter of Potassic Fertilizers ($13.4B), Sawn Wood ($11B), Raw Aluminium ($9.37B), Rapeseed Oil ($4.86B), and Particle Board ($3.38B).
Main local online stores
Amazon Canada, eBay Canada, Walmart Canada, Best Buy Canada, Canadian Tire, Costco Canada, Home Depot Canada, Etsy Canada, Hudson’s Bay, Newegg Canada
Economic freedom
‘Mostly free’ (72.4 out of 100) 1st amongst 32 countries in the Americas region, 16th worldwide out of 184 countries (2024, Heritage Foundation and Wall Street Journal)
Global Innovation Index
Ranked 2nd out of 2 Northern American countries, 15th out of 132 worldwide.
The Global Innovation Index captures the innovation
ecosystem performance of 132 economies and tracks the most recent global innovation trends.
Economy data sources: WTO/OEC/CIA/Esomar/Datareportal
Service Imports (2020)
Service Exports (2020)
Source: OEC
Trade balance of goods from 2013 to 2023
Source: Statista
Historical Data Trade Imports
The following section uses historical trade data imports from partners of Canada.
Historical Data Trade Exports
The following section uses historical trade data exports from partners of Canada.
Source: OEC
Canada's Most Complex Exports
The Product Complexity Index (PCI) measures the knowledge intensity of a product by considering the knowledge intensity of its exporters.
The Top Export Opportunities for Canada by Relatedness
Relatedness measures the distance between a country's current exports and each product by showing only products that Canada is not specialized in.
Source: OEC
Canada's Most Specialized Products
Specialization is measured using Revealed Comparative Advantage (RCA), an index that takes the ratio between Canada observed and expected exports in each product.
Source: OEC
Perception of products made in selected countries in 2017
Source: Statista
Which attributes do you associate with products made in Canada?
Source: Statista
Market Growth Imports (2020)
This score represents the likelihood that the given country will start importing that product in the next few years. It forecasts the opening of a new specific market.
Market Growth Exports (2020)
This score represents the likelihood that the given country will start exporting that product in the next few years. It forecasts the opening of a new specific market.
Source: OEC
Foreign direct investment, net inflows (% of GDP)
Source: WorldBank
Preferred payment method for online shopping in Canada from 2014 to 2018
Most popular online stores in Canda in 2018, by e-commerce net sales
Source: TSYS
Source: eCommerceDB.com

T-index
Reach most of the online purchasing power
T-Index ranks countries according to their potential for online sales. It estimates the market share of each country in relation to global e-commerce.
Try it nowMedia
Media language
French, English, Spanish, Arabic
Information channels
Canada has a long history of public broadcasting. The Canadian Broadcasting Corporation (CBC) was set up in the 1930s in response to the growing influence of American radio. Broadcasting in French and English, CBC’s radio networks carry speech-based and cultural programmes. It operates two national TV channels and TV and radio services for indigenous people in the north. There are hundreds of licensed radio stations in Canada, many of them commercial. There is extensive take-up of multichannel TV. The broadcasting regulator rules that quotas of Canadian material must be carried by TV and radio stations. The media are free to present a wide range of views and opinions. Media freedom “has slipped in ranking due to government transparency issues and controversial antiterrorism legislation”, Reporters Without Borders said in 2019.
The press
The Globe and Mail – Toronto-based national daily
La Presse – Montreal-based daily
Toronto Sun – daily
National Post – daily
Le Journal de Montreal – daily
Vancouver Sun – daily
Montreal Gazette – daily
The Toronto Star – daily
Maclean’s – weekly news magazine
Television
CBC Television – English language public TV network run by the public Canadian Broadcasting Corporation/Société Radio-Canada
CTV – major commercial network
TVA – major French-language commercial network
Aboriginal People’s TV Network (APTN) – Winnipeg-based national network, via cable and satellite
CPAC – parliamentary and political channel
CRTC – regulator; its website has information about the main TV groups
Global Television – major commercial network
Ici Radio-Canada Télé – French language public TV network run by the Canadian Broadcasting Corporation/Société Radio-Canada
Omni TV – broadcasts in multiple languages, focused on immigrant communities
Radio
CBC – public, operates English-language network CBC Radio One, cultural network CBC Radio Two
Société Radio-Canada – public, operates French-language Ici
Radio Canada International – CBC external online outlet, in English, French, Spanish, Chinese, Arabic
CRTC – regulator; its website has information about the main radio groups
News agency
Media data source: BBC
Internet Data
Internet users
94.3% penetration, 36.74 million
Share of web traffic by device
42.03% mobile phones, 54.35% computers (laptops and desktops), 3.55% tablet devices, others 0.07%
Median speed of mobile Internet connection
96.73 Mbps
Median speed of fixed Internet connection
176.47 Mbps
Mobile connection as a percentage of total population: 103.8%
Percentage of mobile connections that are broadband (3G-5G): 99.7%
Most popular web search engines
Google (90.6%), Bing (6.1%), Yahoo! (1.76%), DuckDuckGo (1.13%), Yandex (0.2%), other (0.21%)
Most used social media
Facebook (47.56%), Pinterest (20.58%), Twitter (12.78%), Instagram (9.93%), Reddit (5.15%), YouTube (2.55%), LinkedIn (0.74%), other (0.71%).
Internet data sources: Datareportal/Statcounter
Leading sources trusted for news and information in Canada from 2012 to 2018 (share of respondents)
Source: Edelman
Weekly newspaper reach in Canada as of March 2019, by format
Source: Totum Research News Media Canada
Leading websites in Canada as of January 2020, by average monthly traffic in million visits
Sources: We Are Social; Hootsuite; Digital Report
Social statistics
Life expectancy
81 years (2022)
Current healthcare expenditure
11.15% of GDP (2022)
Current education expenditure
91.5% of total expenditure in public institutions
Co2 emissions
15.4 metric tons per capita
Glass Ceiling Index
65.9 out 100, ranked 11th out of 29 countries.
The glass-ceiling index measures the environment for working women combining data on higher education, labor-force participation, pay, child-care costs, maternity and paternity rights, business-school applications, and representation in senior jobs.
Graduates (tertiary education)
In Canada, in 2018, 62% of 25–34 year-olds had completed a tertiary degree compared to 44% on average across OECD countries.
Corruption Perception Index
Canada scored 74 out of 100, ranked 14 out of 180 countries worldwide.
The CPI measures perception of corruption due to the difficulty of measuring absolute levels of corruption.
World Happiness Index
Canada ranked 15 out of 146 countries, with a score of 7.025.
The World Happiness Index measures happiness based on respondent ratings of their own lives, correlated with other life factors.
Social statistics sources: WorldBank/UN/UNESCO/CEIC/IMF
Change in employment, month over month (in 2020)
| February | March | April | May | June | |
| Canada | 0.2% | -5.3% | -11.0% | 1.8% | 5.8% |
| Newfoundland and Labrador | 0.3% | -2.6% | -13.4% | 5.3% | 3.0% |
| Prince Edward Isalnd | 0.4% | -2.6% | -11.7% | 3.8% | 2.4% |
| Nova Scotia | 0.8% | -5.3% | -11.3% | 2.2% | 7.1% |
| New Brunswick | 0.0% | -4.2% | -9.9% | 5.4% | 6.8% |
| Quebec | 0.5% | -6.0% | -13.5% | 6.5% | 6.5% |
| Ontario | 0.0% | -5.3% | -9.6% | -1.0% | 5.9% |
| Manitoba | 0.5% | -3.8% | -10.0% | 2.3% | 4.9% |
| Saskatchewan | 0.1% | -3.6% | -9.4% | 0.1% | 6.0% |
| Alberta | 0.5% | -5.0% | -11.0% | 1.4% | 4.6% |
| British Columbia | -0.3% | -5.2% | -11.0% | 2.0% | 5.4% |
Total number of jobs dependent on U.S. trade with Canada by job
Source: Embassy of Canada
Country Curiosities
Over 200 languages are spoken as first languages in Canada, making it one of the most diverse countries in the world. About 60 of these are aboriginal languages spoken in hundreds of communities across Canada. With two official languages, English and French, young people are more likely to speak English than French, while the older Canadian population consists of more French speakers.
Additionally…
- Canada ranked as the 4th best country in the world in 2024.
- With the longest coastline in the world, Canada is bordered by three oceans, covering 57% of global coastline.
- Canada is the 2nd largest country globally, but without its lakes, it would be the fourth.
- Producing 71% of the world’s pure maple syrup, Quebec alone makes over 90% of Canada’s supply.
- Canada spans 6 time zones: PST, MST, CST, EST, AST, and NST, showcasing its vast geographic spread.
- Known for extreme cold, Canada set a record low of -63°C (-81.4°F) in Snag, Yukon.
- Home to 52,455 islands, Canada has 260 inhabited islands, adding to its stunning natural diversity.
- Canada is one of the safest countries for LGBTQ+ travelers.
- Canada ranks 2nd in the OECD for the highest proportion of tertiary education graduates.
- Canada is home to three of the world’s ten largest islands: Baffin, Ellesmere, and Victoria.
The Data Factbook is a work in progress project. Our community is helping us to fill it up always with new and updated data. Your contribution is precious. If you want to help us, please write your advices at imminent@translated.com
Languages research
English and French in Canada
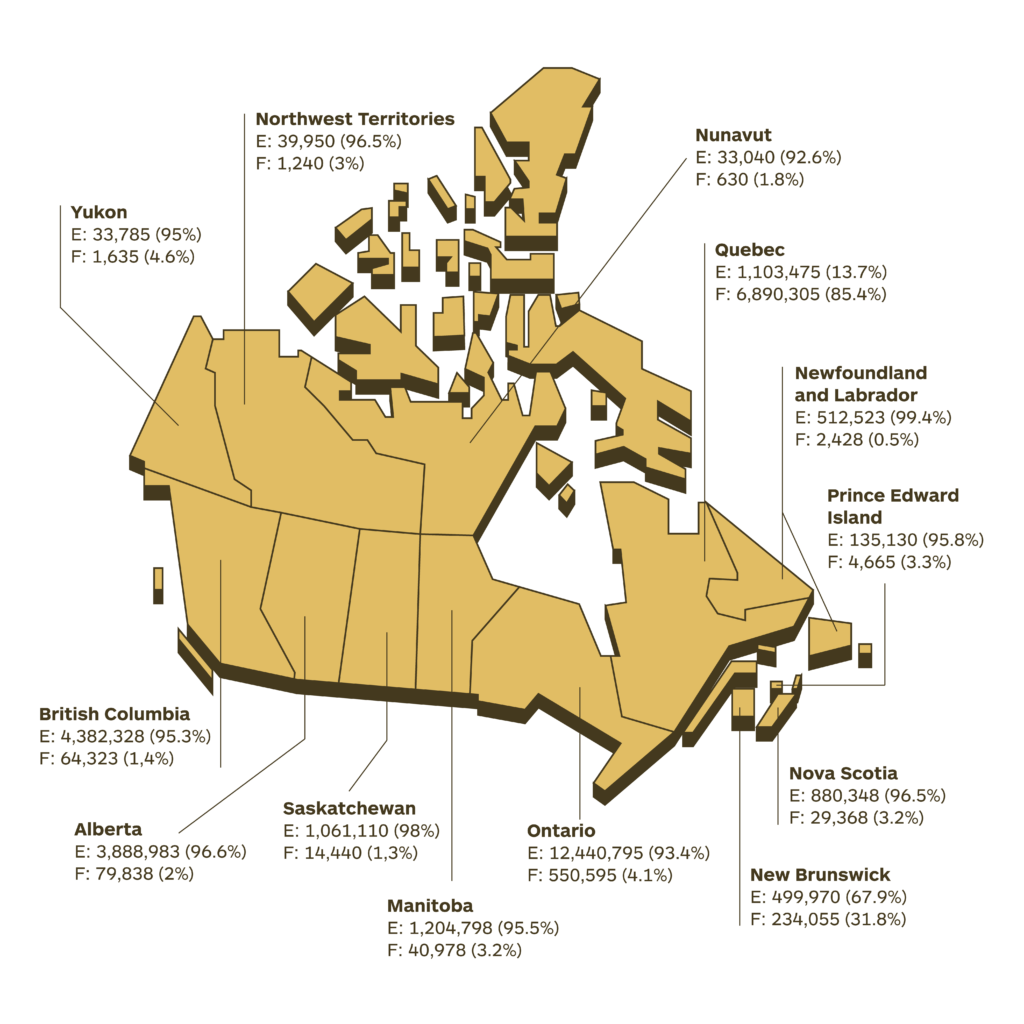
Most spoken languages in every Canadian Province or Territory besides English and/or French
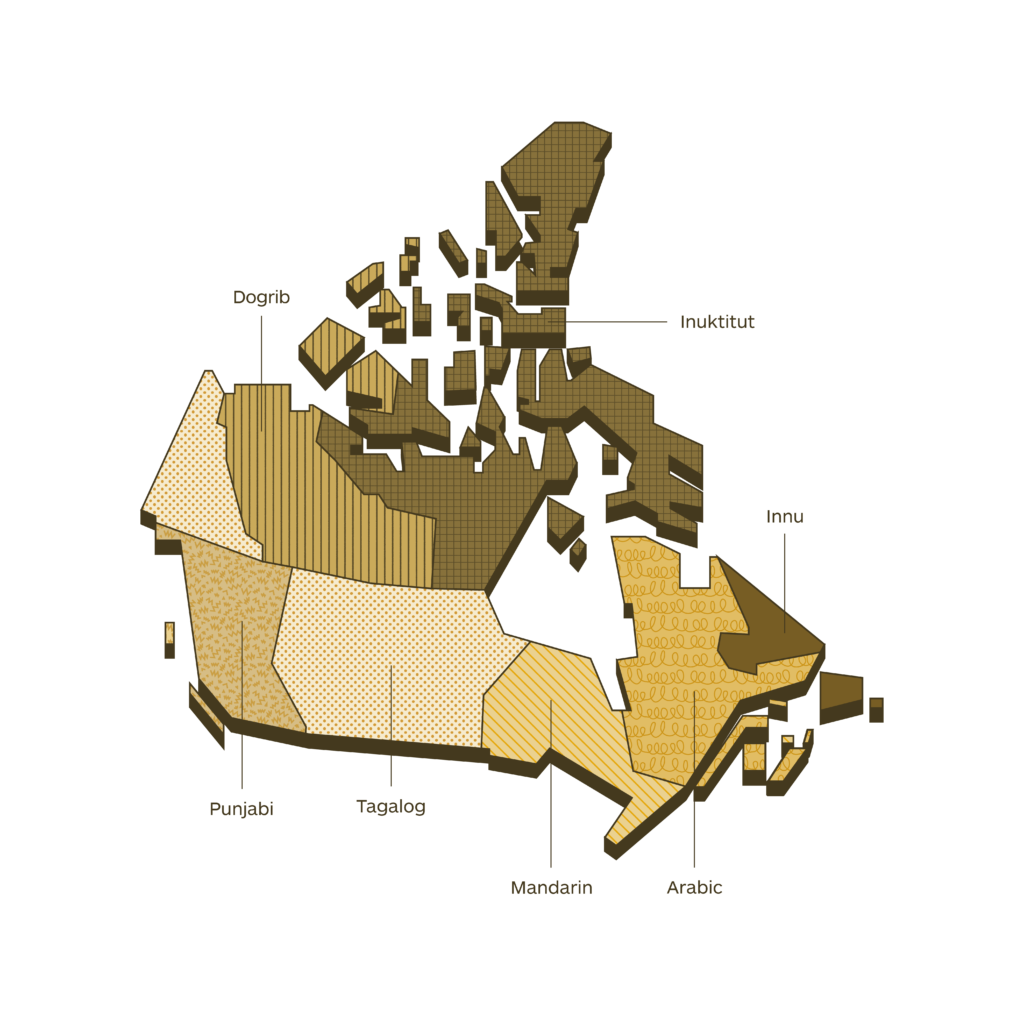
Legend
-
Inuktitut
-
Innu
-
Arabic
-
Mandarin
-
Tagalog
-
Punjabi
-
Dogrib
Immigrant languages in the 6 major census metropolitan areas
Size and percentage of population that reported speaking one of the top 12 immigrant languages most often at home in the six largest census metropolitan areas, in 2011
| Toronto: languages spoken most often | Number | Percentage | Montreal: languages spoken most often | Number | Percentage | Vancouver: languages spoken most often | Number | Percentage |
| Cantonese | 156,425 | 8.8 | Arabic | 107,910 | 17.2 | Punjabi | 126,100 | 17.7 |
| Punjabi | 142,345 | 8 | Spanish | 95,020 | 15.2 | Cantonese | 113,610 | 16 |
| Chinese | 124,960 | 7 | Italian | 50,500 | 8.1 | Chinese | 85,580 | 12.2 |
| Urdu | 105,545 | 5.9 | Chinese | 34,440 | 5.7 | Mandarin | 83,825 | 11.8 |
| Tamil | 102,700 | 5.7 | Creole | 35,015 | 5.4 | Tagalog | 47,640 | 6.7 |
| Tagalog | 99,980 | 5.6 | Greek | 25,235 | 4 | Korean | 38,870 | 5.5 |
| Spanish | 94,315 | 5.3 | Romanian | 24,725 | 3.9 | Persian | 28,970 | 4.1 |
| Mandarin | 91,670 | 5.1 | Vietnamese | 22,375 | 3.6 | Spanish | 22,505 | 3.2 |
| Italian | 81,390 | 4.6 | Russian | 20,335 | 3.2 | Hindi | 18,355 | 2.6 |
| Persian | 69,570 | 3.9 | Portuguese | 17,995 | 2.9 | Vietnamese | 18,225 | 2.6 |
| Portuguese | 65,810 | 3.7 | Persian | 15,530 | 2.5 | Russian | 11,765 | 1.7 |
| Russian | 64,700 | 3.6 | Tamil | 13,730 | 2.2 | Japanese | 9,920 | 1.4 |
| Other immigrant languages | 587,590 | 32.9 | Other immigrant languages | 163,215 | 26.1 | Other immigrant languages | 105,140 | 14.8 |
| Total | 1,786,995 | 100 | Total | 626,045 | 100 | Total | 711,515 | 100 |
| Calgary: languages spoken most often | Number | Percentage | Calgary: languages spoken most often | Number | Percentage | Calgary: languages spoken most often | Number | Percentage |
| Punjabi | 27,435 | 12.1 | Tagalog | 19.645 | 11.8 | Arabic | 28,265 | 20.4 |
| Tagalog | 23.710 | 10.4 | Punjabi | 18.165 | 10.9 | Spanish | 11,325 | 8.1 |
| Chinese | 20,835 | 9.2 | Chinese | 14,810 | 8.9 | Chinese | 10,490 | 7.5 |
| Spanish | 17,900 | 7.9 | Cantonese | 11,260 | 6.8 | Mandarin | 6,205 | 4.4 |
| Cantonese | 16,920 | 7.4 | Spanish | 10,865 | 6.5 | Somali | 5,405 | 3.8 |
| Urdu | 12,320 | 5.4 | Arabic | 9,755 | 5.9 | Persian | 5,225 | 3.7 |
| Arabic | 11,625 | 5.1 | Vietnamese | 6,650 | 4 | Vietnamese | 5,210 | 3.7 |
| Vietnamese | 10,800 | 4.7 | Mandarin | 6,425 | 3.9 | Cantonese | 4,790 | 3.4 |
| Mandarin | 9,900 | 4.4 | Hindi | 5,460 | 3.3 | Russian | 4,550 | 3.2 |
| Korean | 6.565 | 2.9 | Urdu | 5,460 | 3.3 | Italian | 4,110 | 2.9 |
| Russian | 5,755 | 2.5 | Polish | 5,205 | 3.1 | Tagalog | 3,735 | 2.7 |
| Persian (Farsi) | 5,495 | 2.4 | German | 3,770 | 2.3 | Portuguese | 3,570 | 2.5 |
| Other immigrant languages | 58,525 | 25.6 | Other immigrant languages | 48,680 | 29.3 | Other immigrant languages | 47,395 | 33.7 |
| Total | 227,515 | 100 | Total | 166,145 | 100 | Total | 140,675 | 100 |
The geographical distribution of languages that you will find in the maps published in this section is a work in progress. Our community is helping us to fill it up with always new and updated data. Your contribution is precious. If you want to help us, please write to imminent.factbook@translated.com
Photo credit: Nick Reynolds, Unsplash