Asia
To which language should you translate to localize in India?
What we know from our community
There is an old Hindi saying about India and the languages spoken here, “Kos-Kos Par Paani Badle, Char Kos Par Vaani”, which means “After every 18 miles, water changes its characteristics, and Language is different at every 72 miles”. This stands very true for India, here the demography of languages is not linear, but dynamic. Due to the diversity here, the multi-lingual population is vast.
Hindi is one of the official languages (often dubbed as national, but it is not). According to 2011 Census (the latest one), the native Hindi speakers are 528 million, which was 43.63% of the population in 2011. 139 million people in the survey confirmed Hindi as their second language, and 24 million said Hindi is their third language. This essentially means 691 million people (57%) confirmed Hindi as their first, second, or third language. Considering the consistent rise of Hindi as a language — thanks to Bollywood movies — this percentage must have increased since 2011. In the Census 1971, there were 36.99% native Hindi speakers, which rose to 43.63% in 2011.
LANGUAGE INSIGHT
Official languages
Hindi in Devanagari script (40%; 571 mln), English (3.2%; 45.7 mln).
Actual languages
Hindi in Devanagari script (40%; 571 mln), Bengali (8%; 114.2 mln), Telugu (7.2%; 102.8 mln), Marathi (6.7%; 95.7 mln), Tamil (5.8%; 82.8 mln), Urdu (5%; 71.4 mln), Gujarati (4.4%; 62.8 mln), Kannada (3.6%; 51.4 mln), English (3.2%; 45.7 mln), Malayalam (3.2%; 45.7 mln), Odia (3.2%; 45.7 mln), Punjabi (2.8%; 40 mln), Bhojpuri (2.2%; 31.4 mln), Assamese (1.3%; 18.5 mln), Maithili (1.2%; 17.1 mln), other (2.2%; 31.4 mln).
What the top 150 best localized websites in the world do in India
(Top 150 websites listed in the Global by Design ranking – published annually by Byte Level Research, this report provides a list of globally localized websites, showcasing best practices and emerging trends in their globalization)
- 113/150 localize by translating into English.
- 6/150 localize by translating both into English and Hindi.
- 2/150 localize by translating into English, Hindi, Tamil, Telugu, Kannada, Malayalam, Bengali, Marathi, Gujarati, Punjabi and Urdu.
- 1/150 localizes by translating into English, Hindi, Tamil and Telugu.
- 1/150 localizes by translating into English, Hindi, Tamil, Telugu, Kannada and Bengali.
- 1/150 localizes by translating into English, Hindi, Tamil, Telugu, Malayalam and Urdu.
- 1/150 localizes by translating into English, Hindi, Tamil, Telugu, Kannada, Bengali, Marathi and Urdu.
- 1/150 localizes by translating into English, Hindi, Tamil, Telugu, Kannada, Malayalam, Marathi, Bhojpuri, Gujarati, Odia, Punjabi and Urdu.
- 1/150 localizes by translating into English, Hindi, Tamil, Telugu, Kannada, Malayalam, Bengali, and Marathi.
- 1/150 localizes by translating into English, Hindi, Tamil, Telugu, Kannada, Malayalam, Bengali, Marathi, Bhojpuri, Gujarati, Odia, Punjabi and Urdu.
- 1/150 localizes by translating into English, Hindi, Tamil, Telugu, Kannada, Malayalam, Bengali, Marathi, Bhojpuri, Gujarati, Odia, Punjabi, Urdu and Indian Sign Language.
- 1/150 localizes by translating into Hindi.
- 1/150 localizes by translating into English, French, Korean and Japanese.
- 1/150 localizes by translating into English, French and Simplified Chinese.
- 1/150 localizes by translating into English, French, Simplified Chinese, Korean, Japanese, Traditional Chinese, Russian, Italian, Portuguese, Spanish and German.
- 1/150 localizes by translating into English, French, Simplified Chinese, Japanese, Traditional Chinese, Russian, Italian, Portuguese, Spanish, German, Thai, Ukraine, Polish, Hungarian, Bahasa Indonesian, Romanian and Turkish.
- 1/150 localizes by translating into English and Simplified Chinese.
-
 3M
3M
-
ABB
-
Accenture
-
Adidas
-
Adobe
-
Airbnb
-
Aldi
-
Amazon
-
American Airlines
-
American Express
-
Apple
-
Audi
-
Autodesk
-
Avis
-
Bayer
-
BMW
-
Booking.com
-
Bosch
-
British Airways
-
Bumble
-
Burberry
-
BYD
-
Canon
-
Capgemini
-
Cartier
-
Caterpillar
-
Chevrolet
-
Cisco Systems
-
Citibank
-
Coca-Cola
-
Costco
-
Dell
-
Deloitte
-
Delta
-
DHL
-
Disney+
-
Dyson
-
eBay
-
Eli Lilly
-
Emirates
-
Ernst & Young
-
Facebook
-
FedEx
-
Ford
-
Four Seasons
-
Fujifilm
-
GE
-
Gillette
-
GoDaddy
-
Google
-
Gucci
-
Haier
-
Heineken
-
Hermès
-
Hertz
-
Hilton
-
Hisense
-
Hitachi
-
Honda
-
Hotels.com
-
HP
-
HP Enterprise
-
HSBC
-
Huawei
-
Hyatt
-
Hyundai
-
IBM
-
IKEA
-
Intel
-
InterContinental Hotels
-
J&J
-
Jack Daniel's
-
Jehovah’s Witnesses
-
John Deere
-
Kellogg's
-
Kia
-
KPMG
-
L'Oréal
-
Land Rover
-
LEGO
-
Lenovo
-
Lexus
-
LG
-
Louis Vuitton
-
Lululemon
-
LUSH
-
Marriott
-
MasterCard
-
McDonald's
-
Mercedes-Benz
-
Merck
-
Microsoft
-
Mitsubishi Electric
-
Nestlé
-
Netflix
-
Nike
-
Nikon
-
Nintendo
-
Nio
-
Nissan
-
NIVEA
-
Oracle
-
Pampers
-
Panasonic
-
PayPal
-
Pepsi
-
Pfizer
-
Philips
-
Pitney Bowes
-
Porsche
-
Procter & Gamble
-
PWC
-
Revolut
-
Rolex
-
Royal Caribbean
-
Salesforce
-
Samsung
-
Sanofi
-
SAP
-
Sephora
-
Shopify
-
Siemens
-
Sony
-
Spotify
-
Starbucks
-
Steelcase
-
Stripe
-
Subaru
-
Tesla
-
The Church of Jesus Christ of Latter-day Saints
-
Tiffany
-
Tinder
-
Toshiba
-
Toyota
-
TripAdvisor
-
Uber
-
United Airlines
-
UPS
-
Visa
-
Volkswagen
-
Volvo Cars
-
Vrbo
-
Walmart
-
Western Union
-
Wikipedia
-
Wise
-
WordPress
-
Workday
-
Xerox
-
Xiaomi (Mi)
-
Zara
-
Zoom


If you need others information, below you can find a selection of economic/social/cultural data
Overview
Language
Official language
Hindi in Devanagari script and English
T-index
3.9%
T-Index ranks countries according to their potential for online sales.
Other languages
Bengali, Telugu, Marathi, Tamil, Urdu, Gujarati, Kannada, English, Malayalam, Odia, Punjabi, Bhojpuri, Assamese, Maithili.
Indigenous (1.9%) : Apalaí, Arára, Bororo, Canela, Carajá, Carib, Guarani, Kaingang, Nadëb, Nheengatu, Pirahã, Terena, Tucano, Tupiniquim, Ye’kuana.
English
Moderate proficiency (EF) – 60 of 113 countries/regions in the world- 9/23 position in Asia.
Demography
Capital: New Delhi
Currency: Indian rupees
Population: 1.44 billion
Population density: 473/km2
Economy
GDP: 3.42 Trillion USD (2022)
GDP per capita: 2,410.9 USD (2022)
Exports: $468 billion (2022)
Statistics
Internet users: 52.4% penetration, 751.5 million.
Unemployment rate: 4.7% (2022)
Urbanisation: 36.6% (2024)
Literacy: 76.3% (2024)
Conventions
Numbering system
Arabic numbering system and point as decimal separator.
Date format: yyyy-mm-dd / dd-mm-yyyy
Time: 24h time system
Country code: 0091
Language data sources: Worldatlas/Britannica//EF/Wikipedia; Demography data sources: IMF/Worldometers; Conventions data source: Wikipedia; Economy data sources: WTO/OEC/CIA/Esomar/Datareportal; Statistics data sources: Datareportal/WorldBank/UN/UNESCO/CEIC/IMF/Culturalatlas/Commisceoglobal/Worlddata.info
Facts and data
Economy
Imports
$724 billion (2022). Crude Petroleum ($170B), Coal Briquettes ($58.7B), Gold ($35.8B), Petroleum Gas ($32B), and Diamonds ($26.1B), importing mostly from China ($110B), United Arab Emirates ($51B), United States ($48.5B), Saudi Arabia ($46.2B), and Russia ($40.4B).
Financial inclusion factors (over 15 years of age)
• 80% have an account with a financial institution
• 3% have a credit card
• 2% have a mobile money account
• 4.3% make online purchases
Ease of doing business
Easy to conduct business (63 out of 100) 1st out of 8 South Asian countries 71st worldwide out of 190 countries (2022, World Bank).
Global Innovation Index
Ranked 1st out of 10 Central and Southern
Asian countries, 40th out of 132 worldwide.
The Global Innovation Index captures the innovation
ecosystem performance of 132 economies and tracks the most recent global innovation trends.
Exports
$468 billion (2022). Refined Petroleum ($86.2B), Diamonds ($25.9B), Packaged Medicaments ($19.5B), Jewellery ($12.6B), and Rice ($11.1B), exporting mostly to United States ($82.9B), United Arab Emirates ($31.6B), Netherlands ($17.6B), China ($15.3B), and Bangladesh ($13.8B).
Main local online stores
Amazon, Flipkart.com, Snapdeal.com, PaytmMall.com, ebay.in, jabong.com, myntra.com, shopclues.com, pepperfry.com, homeshop18.com
Economic freedom
Mostly not free (52.9 out of 100) 26th out of 39 countries in the Asian Pacific region, 126 worldwide out of 186 countries (2024, Heritage Foundation and Wall Street Journal).
Economy data sources: WTO/OEC/CIA/Esomar/Datareportal
Service Imports (2020)
Service Exports (2020)
Source: OEC
Trade Balance of Goods from 2012 to 2022
Source: Statista
Historical Data Trade Imports (2020)
The following section uses historical trade data imports from partners of India.
Historical Data Trade Exports (2020)
The following section uses historical trade data exports from partners of India.
Source: OEC
The Top Export Opportunities for India by Relatedness
Relatedness measures the distance between a country's current exports and each product by showing only products that India is not specialized in.
India's Most Complex Exports
The Product Complexity Index (PCI) measures the knowledge intensity of a product by considering the knowledge intensity of its exporters.
Source: OEC
India's Most Specialized Products
Specialization is measured using Revealed Comparative Advantage (RCA), an index that takes the ratio between India observed and expected exports in each product.
Source: OEC
Perception of products made in selected countries in 2017
Source: Statista
Which attributes do you associate with products made in India?
Source: Statista
Market Growth Imports (2020)
This score represents the likelihood that the given country will start importing that product in the next few years. It forecasts the opening of a new specific market.
Market Growth Exports (2020)
This score represents the likelihood that the given country will start exporting that product in the next few years. It forecasts the opening of a new specific market.
Source: OEC
Foreign direct investment, net inflows (% of GDP)
Source: WorldBank
Preferred digital payment methods in 2015 and 2020
Sources: A.T. Keamey; GfK; Google

T-index
Reach most of the online purchasing power
T-Index ranks countries according to their potential for online sales. It estimates the market share of each country in relation to global e-commerce.
Try it nowMedia
Media main languages Hindi, English
Information channels
India has a flourishing media scene, with thousands of outlets operating in multiple languages. There are around 197 million homes with TVs, many of them using direct-to-home satellite and cable services. Nearly 900 private satellite TV stations are on the air, around half of them devoted to news coverage. Doordarshan, the public TV, operates multiple services, including flagship DD1, which reaches hundreds of millions of viewers. Multichannel satellite TV is a huge success. Over The Top (OTT) streaming platforms have a large following. Music-based FM radio stations abound. But only public All India Radio can produce news programming. Driven by a growing middle class, the cumulative newspaper circulation figure is more than 400 million. International organisations give a mixed assessment of media freedom. Privately-owned media are “vigorous and diverse” says US-based Freedom House. But it states that the authorities use security, defamation and hate speech legislation to curb critical voices. Reporters Without Borders (RSF) highlights the problem of violence against journalists, especially those working for non-English-language-media in rural areas.
India online
There were 560 million internet users by March 2019 the second largest number of internet users in the world after China. Internet use has been slower to take hold in rural India. Facebook is the leading social network, with around 300 million users by 2019. Twitter is used by celebrities, journalists and politicians. Some of them have a mass following. There is no systematic filtering of the web. The authorities have clashed with leading social networks over censorship of content deemed to be offensive. The authorities routinely suspend internet services in Indian-administered Kashmir at times of tension.
The press
The Times of India – Mumbai-based daily
The Hindu – Chennai-based daily
The Hindustan Times – New Delhi-based daily
The Pioneer – New Delhi-based daily
The Indian Express – New Delhi-based daily
The Statesman – Kolkata-based daily
Deccan Herald – Bangalore-based daily
The Asian Age – New Delhi-based daily
India Today – New Delhi-based news magazine
Outlook – New Delhi-based news magazine
Television
Doordarshan – public; national, regional, local and satellite services
CNN News18, external – 24-hour news in English
New Delhi TV (NDTV) – operates NDTV 24×7 and NDTV-India news channels in English and Hindi
Star TV – satellite, cable
Zee TV – satellite, cable
Aaj Tak – news channel in Hindi
Radio
All India Radio – public, operates domestic and external networks
Radio One – commercial
Radio Mirchi – commercial
Radio City – commercial
Red FM – commercial
News agency
Press Trust of India (PTI) -non-profit, owned by Asian News International (ANI) – commercial, privately-owned multimedia news agency
Indo-Asian News Service (IANS) – privately-owned newswire
Media data source: BBC
Internet Data
Internet users
52.4% penetration, 751.5 million.
Share of web traffic by device
78.62% mobile phones, 20.95% computers (laptops and desktops), 0.43% tablet devices.
Median speed of mobile Internet connection
9.02 Mbps
Median speed of fixed Internet connection
58.62 Mbps
Mobile connection as a percentage of total population 78%
Percentage of mobile connections that are broadband (3G-5G): 86.4%
Most popular web search engines
Google (97.95%), Bing (1.18%), Yahoo (0.43%), Duckduckgo (0.08%), YANDEX (0.02%), Ecosia (0.01%).
Most used social media
Facebook (72.48%), Instagram (18.81%), YouTube (6.05%), Twitter (1.11%), Pinterest (0.95%), LinkedIN (0.33%).
Internet data sources: Datareportal/Statcounter
Social statistics
Life expectancy
68 yrs (2022)
Average age of the population
28.7 yrs (2022)
Current education expenditure
95.2% of total expenditure in public institutions.
Co2 emissions
1.6 metric tons per capita.
Corruption Perception Index
India scored 40 out of 100, ranked 85 out of 180 countries worldwide.
The CPI measures perception of corruption due to the difficulty of measuring absolute levels of corruption.
Healthcare expenditure
3.28% of GDP (2021)
Graduates (tertiary education)
Despite the lower share of adults with tertiary education, India has a relatively balanced gender distribution across the various fields of tertiary education compared to other OECD and partner countries, especially in fields such as education, humanities and arts, and health and welfare.
World Happiness Index
India ranked 136 out of 146 countries, with a score of 3.777.
The World Happiness Index measures happiness based on respondent ratings of their own lives, correlated with other life factors.
Social statistics sources: WorldBank/UN/UNESCO/CEIC/IMF
Impact on unemployment rate due to the coronavirus (COVID-19) lockdown in India from January to May 2020
Source: Statista
Share of unemployment across India in 2019, by educational qualification
Ministry of Human Resource Development
Level of education of the young male and female population (15-32 years)
| Level of education | Rural areas | Urban areas | Total | Rural areas | Urban areas | Total |
|---|---|---|---|---|---|---|
| 2009-2010 | 2004-2005 | |||||
| Level of education | Rural areas | Urban areas | Total | Rural areas | Urban areas | Total |
| Non literate | 22.6% | 10.1% | 19.3% | 32.8% | 13.9% | 28.3% |
| Poorly literate | 10.5% | 5.8% | 9.3% | 12.2% | 8.1% | 11.2% |
| Primary education cycle | 18.3% | 13% | 16.9% | 16.6% | 15.5% | 16.4% |
| Intermediate cycle | 23.4% | 20.4% | 22.6% | 20.5% | 22.5% | 20.9% |
| First cycle secondary school | 13.5% | 16.7% | 14.3% | 9.3% | 13.9% | 10.4% |
| Second cycle secondary school | 7.6% | 13.5% | 9.1% | 5.5% | 12% | 7% |
| Bachelor’s degree | 3.3% | 15.2% | 6.4% | 2.5% | 11% | 4.5% |
| Master’s degree | 0.8% | 5.2% | 2.0% | 0.7% | 3.2% | 1.3% |
Student enrolment in India
Ministry of Human Resource Development
Distribution of enrolment among various categories
Ministry of Human Resource Development
Level- wise enrollment and its compund annual growth rate
Enrolment at all the levels has increased over the years. The Compound Annual Growth Rate (CAGR) is 1.8 during the last 5 years, but in case of integrated courses, the CAGR is 11.2.
| Year | Ph.D. | M.Phil | Post graduate | PG Diploma | Diploma | Certificate | Integrated | Grand Total |
|---|---|---|---|---|---|---|---|---|
| 2014-2015 | 117301 | 33371 | 3853538 | 215372 | 2507694 | 170245 | 141870 | 34211637 |
| 2015-2016 | 126451 | 42523 | 3917156 | 229559 | 2549160 | 144060 | 155422 | 34584781 |
| 2016-2017 | 141037 | 43267 | 4007570 | 213051 | 2612209 | 166617 | 173957 | 35705905 |
| 2017-2018 | 161412 | 34109 | 4114310 | 235263 | 2707934 | 177223 | 195777 | 36642378 |
| 2018-2019 | 169170 | 30692 | 4042522 | 224711 | 2699395 | 162697 | 241126 | 37999388 |
| CAGR | 7.6 | -1.71 | 1.0 | 0.9 | 1.5 | -0.9 | -0.9 | 1.8 |
The Data Factbook is a work in progress project. Our community is helping us to fill it up always with new and updated data. Your contribution is precious. If you want to help us, please write your advices at imminent@translated.com
Country Curiosities
India is the world’s largest film producer and boasts the second-oldest film industry globally. With a vast national following and a significant international audience, the impact of Indian cinema is substantial. Bollywood, the renowned film hub in Mumbai, produces about 200 films annually, while the country overall produces around 1,100 films each year, making it the top film producer worldwide. However, the most prolific production centers are actually in Chennai and Hyderabad rather than Mumbai.
Additionally…
- India has the largest vegetarian population in the world, with over 26% of its citizens being vegetarian (Statista).
- India proudly holds the title of the tiger capital of the world, home to 75% of the global tiger population.
- Varanasi, the spiritual capital of India located on the sacred Ganges River, is the oldest Indian city, with a history dating back over 3,000 years.
- India ranks second behind the USA in terms of English speakers, with 10% of its population (125 million people) fluent and about 30% proficient. The country has 23 officially recognized languages, and there are a further 19,500 languages and dialects recorded.
- One of the most confusing habits for Westerners is the Indian head shake, which signifies “yes” instead of “no.”
- India has over 300,000 mosques, more than any other country, with 13% of its population being Muslim, making it the third-largest Muslim population globally.
- There are an estimated 5 to 6 million hijras or third-gender people in India, who are campaigning for official recognition.
- In West Bengal, cows have ID cards to prevent smuggling into Bangladesh, an initiative that started in 2007.
- The world’s largest family lived in India: before dying in 2021, Ziona Chana had 39 wives, 94 children, and 39 grandchildren.
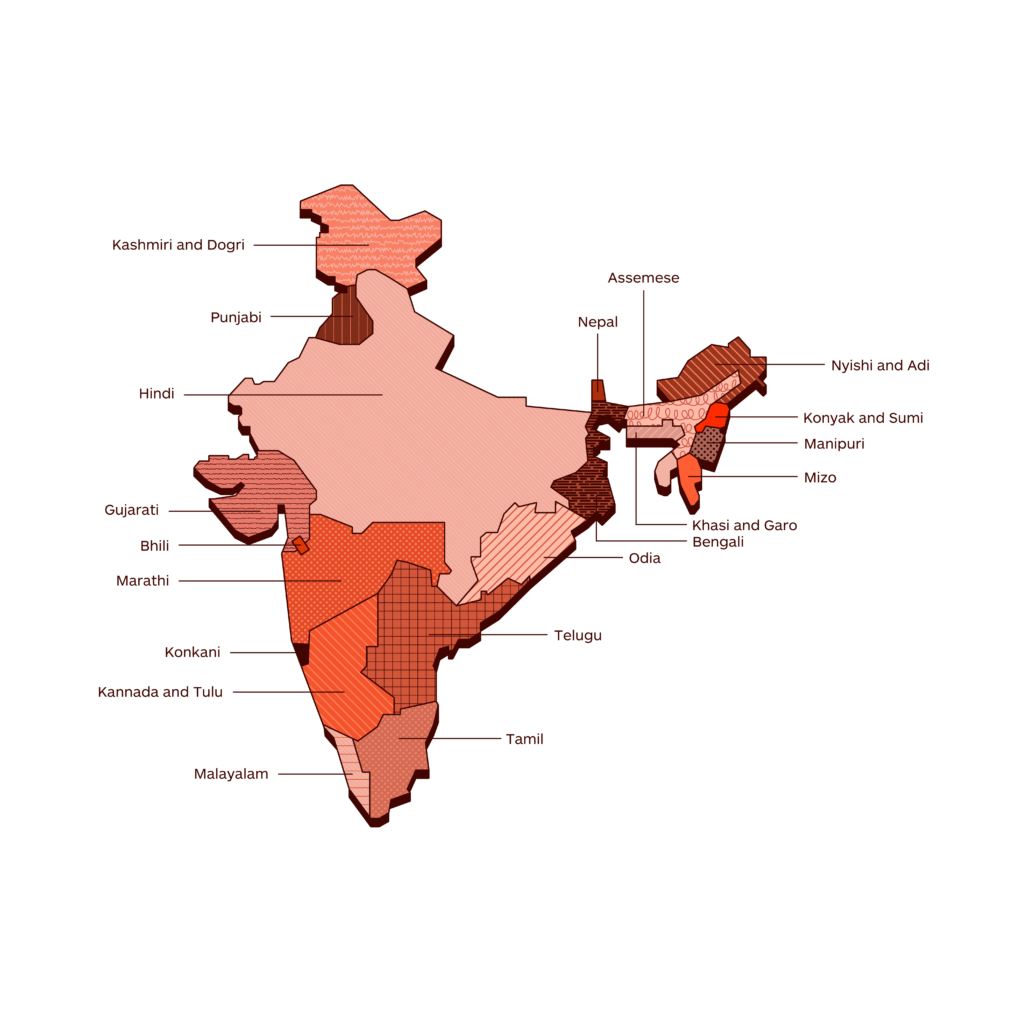
Languages research
Languages spoken in India
Hindi reaches 10% global website penetration
Globalization Report Card 2021
Different Variants of Tamil Language
It is fairly normal among languages spoken across the world to have multiple variants; however, in this connotation Tamil is noteworthy. Tamil, the native language of Tamil Nadu, India has widened its reach to various states within India and world countries including Northeast region of Sri Lanka, Singapore, Malaysia, Mauritius, Indonesia, China, Australia, Canada, UK, South Africa, South Pacific, Caribbean, and more to list out.
The variants of Tamil is distinguished majorly by factors like community divisions, and regional dialects (a cause of geographic conditions) such as Kanchipuram Tamil, Chennai Tamil, Tiruvannamalai Tamil, Madurai Tamil, Thirunelveli Tamil, Coimbatore Tamil, Kanyakumari Tamil, Ramanathapuram Tamil, Pudhukottai Tamil, Chettinadu Tamil, and more. Tamil spoken at the borders of neighbouring states like Kerala, Karnataka and Andhra Pradesh has a different diglossia.
Similarly, Tamil used for writing, Television, Radio, and public speeches may vary from spoken Tamil. Tamil in literary works has a different style expressed. Perhaps, the face to face communication brings a different variant, which is quite interesting to listen to.
Dialects
As per the Census 2011, Hindi has now 57 officially recognised dialects, and several unrecognised dialects. Out of 528 million native Hindi speakers, 16.7 million belong to these unrecognised dialects.
States
Most of the Hindi native speakers are found in the northern part of India, often called as Hindi belt.
Indian languages online share
Indian language users – 2016 (in million)
Source: KPMG
The geographical distribution of languages that you will find in the maps published in this section is a work in progress. Our community is helping us to fill it up with always new and updated data. Your contribution is precious. If you want to help us, please write to imminent.factbook@translated.com
Photo credit: Abhay Singh, Unsplash