North America
To which language should you translate to localize in the United States?
What we know from our community
“English is the most common language spoken in the United States, with approximately 239 million speakers. However, there are actually between 350 and 430 languages spoken there, making it one of the most linguistically diverse countries in the world. The federal government has never declared an official language, but some state governments have adopted English as their official language, with varying policies for other languages. There are roughly 30 different major dialects in America; for example, people living in the southwest will not refer to a carbonated beverage using the same word as those from the south or east coast. Americans also have drastically different accents depending on which part of the country they come from.
After English, Spanish is spoken by over 40 million people in the USA, with some regions carrying a high percentage of this number: just consider, 42% of the population in Los Angeles are native Spanish speakers. The United States is a vast territory abounding with opportunities for companies abroad. They should make sure to localize their content for specific areas, considering other languages depending on these targets.”
LANGUAGE INSIGHT
Main language
American English (78%; 261.23 mln)
Actual languages
American English (78%; 261.23 mln), Spanish (13.3%; 44.54 mln), other (8.7%; 29.13 mln)
What the top 150 best localized websites in the world do in the United States
(Top 150 websites listed in the Global by Design ranking – published annually by Byte Level Research, this report provides a list of globally localized websites, showcasing best practices and emerging trends in their globalization)
- 113/150 localize by translating into English
- 25/150 localize by translating into both English and Spanish
- 1/150 localizes by translating into English, Spanish, Simplified Chines and Traditional Chinese
- 1/150 localizes by translating into English, Spanish and Simplified Chinese
- 1/150 localizes by translating into English, Spanish, Simplified Chinese, Traditional Chinese, Arabic, German, Hebrew, Korean and Portuguese
- 1/150 localizes by translating into English, Spanish, Simplified Chinese, Traditional Chinese, Arabic, German, Portuguese, French, Polish, Italian, Japanese, Czech, Hungarian, Dutch and Swedish
- 1/150 localizes by translating into both English and American Sign Language
- 1/150 localizes by translating into English, American Sign Language, Navajo Language, Hawaiian Language, Western Apache Language and Powhatan Language
- 1/150 localizes by translating into English, Navajo Language, Hawaiian Language and Pennsylvania German
- 1/150 localizes by translating into both English, Spanish, Traditional Chinese and Korean
- 1/150 localizes by translating into English, Spanish, Simplified Chinese, Traditional Chinese, German, Korean, Portuguese, French, Russian, Italian and Japanese
- 1/150 localizes by translating into English, Simplified Chinese and French
- 1/150 localizes by translating into English, Spanish, Simplified Chinese, German, Korean, Portuguese, French, Polish, Russian, Italian and Japanese
- 1/150 localizes by translating into both English, Spanish, Portuguese and French
- 1/150 localizes by translating into both English, Spanish and Korean
-
 3M
3M
-
ABB
-
Accenture
-
Adidas
-
Adobe
-
Airbnb
-
Aldi
-
Amazon
-
American Airlines
-
American Express
-
Apple
-
Audi
-
Autodesk
-
Avis
-
Bayer
-
BMW
-
Booking.com
-
Bosch
-
British Airways
-
Bumble
-
Burberry
-
BYD
-
Canon
-
Capgemini
-
Cartier
-
Caterpillar
-
Chevrolet
-
Cisco Systems
-
Citibank
-
Coca-Cola
-
Costco
-
Dell
-
Deloitte
-
Delta
-
DHL
-
Disney+
-
Dyson
-
eBay
-
Eli Lilly
-
Emirates
-
Ernst & Young
-
Facebook
-
FedEx
-
Ford
-
Four Seasons
-
Fujifilm
-
GE
-
Gillette
-
GoDaddy
-
Google
-
Gucci
-
Haier
-
Heineken
-
Hermès
-
Hertz
-
Hilton
-
Hisense
-
Hitachi
-
Honda
-
Hotels.com
-
HP
-
HP Enterprise
-
HSBC
-
Huawei
-
Hyatt
-
Hyundai
-
IBM
-
IKEA
-
Intel
-
InterContinental Hotels
-
J&J
-
Jack Daniel's
-
Jehovah’s Witnesses
-
John Deere
-
Kellogg's
-
Kia
-
KPMG
-
L'Oréal
-
Land Rover
-
LEGO
-
Lenovo
-
Lexus
-
LG
-
Louis Vuitton
-
Lululemon
-
LUSH
-
Marriott
-
MasterCard
-
McDonald's
-
Mercedes-Benz
-
Merck
-
Microsoft
-
Mitsubishi Electric
-
Nestlé
-
Netflix
-
Nike
-
Nikon
-
Nintendo
-
Nio
-
Nissan
-
NIVEA
-
Oracle
-
Pampers
-
Panasonic
-
PayPal
-
Pepsi
-
Pfizer
-
Philips
-
Pitney Bowes
-
Porsche
-
Procter & Gamble
-
PWC
-
Revolut
-
Rolex
-
Royal Caribbean
-
Salesforce
-
Samsung
-
Sanofi
-
SAP
-
Sephora
-
Shopify
-
Siemens
-
Sony
-
Spotify
-
Starbucks
-
Steelcase
-
Stripe
-
Subaru
-
Tesla
-
The Church of Jesus Christ of Latter-day Saints
-
Tiffany
-
Tinder
-
Toshiba
-
Toyota
-
TripAdvisor
-
Uber
-
United Airlines
-
UPS
-
Visa
-
Volkswagen
-
Volvo Cars
-
Vrbo
-
Walmart
-
Western Union
-
Wikipedia
-
Wise
-
WordPress
-
Workday
-
Xerox
-
Xiaomi (Mi)
-
Zara
-
Zoom

If you need others information, below you can find a selection of economic/social/cultural data
Overview
Language
Main language
American English (78%)
Other languages
Spanish (13.3%), other (8.7%)
Indigenous languages
Navajo, Cherokee, Choctaw, Muscogee, Dakota, Lakota, Western Apache, Keres, Hopi, Zuni, Kiowa, Ojibwe, O’odham, Miwuk
T-index
33.4%
T-Index ranks countries according to their potential for
online sales.
Demography
Capital: Washington D.C.
Currency: US dollar
Population: 340.11M
Population density: 37/km2
Economy
GDP: 28.75 trillion USD (2024)
GDP per capita: 84,534.0 USD (2024)
Exports: $1.95 trillion (2023)
Statistics
Internet users: 93.1% penetration, 324 million
Unemployment rate: 4% (2024)
Urbanisation: 80% (2024)
Literacy: 99% (2023)
Conventions
Numbering system
Arabic numerals with dot as decimal separator
Date format: mm-dd-yyyy
Time: 12h time system (a.m./p.m.)
Country code: 001
Language data sources: Worldatlas/Britannica/Wikipedia; Demography data sources: IMF/Worldometers; Conventions data source: Wikipedia; Economy data sources: WTO/OEC/CIA/Esomar/Datareportal; Statistics data sources: Datareportal/WorldBank/UN/UNESCO/CEIC/IMF/Culturalatlas/Commisceoglobal/Census Data Of USA
Facts and data
Economy
Imports
$2.98 trillion (2023). Computers ($25.5B), Telephones ($15.4B), Cars ($14.2B), Commodities not elsewhere specified ($13B), and Office Machine Parts ($11.2B), importing mostly from Mexico ($48.5B), Canada ($31.1B), China ($23.9B), Chinese Taipei ($22.3B), and Vietnam ($17.8B).
Financial inclusion factors (over 15 years of age)
• 97% have an account with a financial institution
• 66.7% have a credit card
• 27% have a mobile money account
• 77% make online purchases
Ease of doing business
It is very easy to conduct business (rated 84.0 out of 100) ranked 4th out of 44 countries among OECD high income ranked 6th out of 190 countries worldwide (2023, World Bank).
Exports
$1.95 trillion (2023). Gold ($16.7B), Aircraft parts (gliders, balloons, and powered aircraft) ($13.5B), Crude Petroleum ($8.92B), Refined Petroleum ($8.69B), and Petroleum Gas ($6.41B) exporting mostly to Mexico ($29.6B), Canada ($29.2B), Switzerland ($12.7B), United Kingdom ($11.7B), and China ($8.95B),
Main local online stores
Amazon.com, Walmart.com, Apple.com, Homedepot.com, Bestbuy.com, Target.com, Macys.com, Wayfair.com, Costco.com, Kohis.com.
Economic freedom
‘Mostly free’ (70.2 out of 100) ranked 3rd out of 32 countries in the Americas region, ranked 26th out of 184 countries worldwide (2025, Heritage Foundation and Wall Street Journal).
Global Innovation Index
Ranked 1st out of 2 Northern American countries, 3rd out of 132 worldwide.
The Global Innovation Index captures the innovation ecosystem performance of 132 economies and tracks the most recent global innovation trends.
Economy data sources: WTO/OEC/CIA/Esomar/Datareportal
Service Imports (2018)
Service Exports (2018)
Source: OEC
Trade balance of goods from 2014 to 2024
Source: Statista
Historical Data Trade Imports (2018)
The following section uses historical trade data imports from partners of United States.
Historical Data Trade Exports (2018)
The following section uses historical trade data exports from partners of United States.
Source: OEC
The Top Export Opportunities for United States by Relatedness
Relatedness measures the distance between a country's current exports and each product by showing only products that United States is not specialized in.
United States' Most Complex Exports
The Product Complexity Index (PCI) measures the knowledge intensity of a product by considering the knowledge intensity of its exporters.
Source: OEC
Perception of products made in selected countries in 2017
Source: Statista
Which attributes do you associate with products made in USA?
Source: Statista
Foreign direct investment, net inflows (% of GDP)
Source: WorldBank
Leading payment methods in the United States in 2018
Source: Worldpay
Most popular online stores in the United States in 2018, by e-commerce net sales
(in million U.S. dollar)
Source: ecommerceDB.com
Most popular mobile shopping apps in the United States as of September 2019, by reach
Source: Veroanalytics
Conversion rate of online shopping in the United States in 2019, by device
Source: Worldpay
Share of mobile device owners in the United States who have performed select mobile shopping activities via app in the past month as of December 2019
Source: Monetate

T-index
Reach most of the online purchasing power
T-Index ranks countries according to their potential for online sales. It estimates the market share of each country in relation to global e-commerce.
Try it nowMedia
Media language English
Information channels
The US has the most highly-developed mass media in the world. Its dramas, comedies, soap operas, animations, music videos and films have a global audience and are part of the staple fare of broadcasters worldwide.
TV is America’s most popular medium. ABC, CBS and NBC held sector leadership for decades until the mass take-up of cable and satellite and the arrival of the Fox network. Fox News Channel is the dominant US cable news network. But viewing habits are changing and the proportion of consumed content accounted for by live broadcast TV is falling. The US leads the world in the adoption of over-the-top (OTT) video-on-demand, delivered by broadband internet.
“The US has a free, diverse, and constitutionally protected press,” says Washington-based Freedom House (2019). The NGO says news coverage has become more polarised, with some outlets and well-known commentators “providing a consistently right- or left-leaning perspective”.
Public Broadcasting
Public broadcasting is partly government-funded, but also supported by private grants. Universities and colleges operate outlets. National Public Radio (NPR) – with hundreds of affiliate stations – offers news, debate and music without advertising. Public TV services operated by PBS have a mission to provide “quality” and educational programming. The government sponsors TV, radio and online outlets aimed at audiences outside the US, including in the former Soviet bloc, the Middle East and Asia, and Cuba. There are more than 1,000 daily newspapers in the US, most of them with a local or regional readership, but they have been hit by online competition.
News agency
The press
USA Today – national daily
The Wall Street Journal – business daily
The Christian Science Monitor – church-owned daily
Los Angeles Times – daily
The Washington Post – daily
The Boston Globe – daily
New York Post – daily
The New York Times – daily
The Philadelphia Inquirer – daily
The Baltimore Sun – daily
Chicago Tribune – daily
Newsweek – news weekly
Time – news weekly
US News & World Report – news weekly
Television
ABC – major commercial network
CBS – major commercial network
NBC – major commercial network
Fox – major commercial network
CNN – pioneer of 24-hour rolling TV news, operates domestic and international streams
MTV – pioneer of music television
HBO (Home Box Office) – pay TV network; originator of some of American TV’s most critically–acclaimed programmes
PBS (Public Broadcasting Service) – public TV, serves some 350 non-commercial member stations
Radio
NPR (National Public Radio) – non-commercial network of member stations; news, information and cultural programmes
iHeart Media – America’s largest commercial radio operator, owns more than 1,200 stations
Entercom – major commercial operator
Cumulus Media – major commercial operator
External broadcasting
Voice of America – government-funded, programmes for global audiences in many languages
Radio Free Europe, Radio Liberty – government-funded, targets eastern Europe, former Soviet Union and the Caucasus in local languages
Radio Free Asia – government funded, targets China, North Korea and South East Asia
Al-Hurra – government-funded, satellite TV for Middle East
Radio Sawa – government-funded, Arabic-language radio for Middle East
Radio Farda – government-funded, Persian-language radio
Radio and TV Marti – government-funded services for Cuba
Media data source: BBC
Internet Data
Internet users
93.1% penetration, 324 million.
Share of web traffic by device
47.05% mobile phones, 50.52% computers (laptops and desktops), 2.38% tablet devices, 0.06% others.
Average speed of mobile Internet connection
154.48 Mbps
Average speed of fixed Internet connection
285.59 Mbps
Mobile connection as a percentage of total population: 120%
Percentage of mobile connections that are broadband (3G-5G): 100%
Most popular web search engines
Google (85.72%), Bing (7.95%),Yahoo (3.22%), Duckduckgo (2.47%), Yandex (0.34%), Ecosia (0.12%), AOL (0.11%), others (0.07%).
Most used social media
Facebook (62.35%), X (13.23%), Instagram (9.32%), Pinterest (9.10%), YouTube (2.47%), Reddit (1.85%), LinkedIn (0.84%), others (0.84%).
Data sources: Datareportal/Statcounter
Social statistics
Life expectancy
78 yrs (2023)
CO2 emissions
13.8 metric tons per capita (2023)
Corruption perceptions Index
USA scored 65 out of 100, ranked 28th out of 180 countries worldwide.
Glass Ceiling Index
58.2 out 100, ranked 18th out of 29 countries.
The glass-ceiling index measures the environment for working women combining data on higher education, labor-force participation, pay, child-care costs, maternity and paternity rights, business-school applications, and representation in senior jobs.
Current health expenditure
16.57% of GDP (2022)
Education expenditure
90% of total expenditure in public institutions (2020).
World Happiness Index
USA ranked 24 out of 147 countries, with a score of 6.724.
Social statistics sources: WorldBank/UN/UNESCO/CEIC/IMF/US Census Bureau/Data Reportal
Number of U.S. population in 2019, by educational attainment
(population in 1,000s)
Source: US census Bureau
Household food insecurity
Source: Urban Institute
Average cost to attend university per year in the United States from the academic year 2000/1 to 2017/18
(in U.S. dollar)
Source: Institute for College Access & Success
Social statistics sources: WorldBank/UN/UNESCO/CEIC/IMF
Where do American students have the highest debt?
Average students debt per borrower in selected U.S. states in the first decade of the 20th century
Source: US Department of Education
The Data Factbook is a work in progress project. Our community is helping us to fill it up always with new and updated data. Your contribution is precious. If you want to help us, please write your advices at imminent@translated.com
Country Curiosities
Though English is the de facto national language in the U.S., there’s no official language at the federal level, making it the most populous country without one—a unique status rooted in the nation’s values of inclusion and diversity. This openness has fostered a vibrant linguistic landscape, with over 350 languages spoken across the country, from Spanish and Chinese to indigenous languages like Navajo and Hawaiian. Some states, such as Hawaii, recognize additional languages to honor local heritage, while others have made English official through state laws.
Additionally…
- The U.S. leads the world economy with a $28.75 trillion GDP, contributing about 24% of global output.
- American tech giants like Apple and Google drive the tech industry with $2 trillion in GDP and $400 billion in tech exports.
- The U.S. holds the largest AI market globally, valued at $50.16 billion in 2024.
- Approximately 58 million Americans use language learning apps, increasing national multilingualism.
- U.S. private consumption, 68% of GDP, makes Americans leading global consumers in tech, entertainment, and luxury goods.
- Alaska supports cultural preservation by recognizing 20 Indigenous languages alongside English.
- The U.S. government invests around $3.3 billion annually in AI research and development.
- Americans consume 400 million cups of coffee daily, making the U.S. a top coffee consumer worldwide.
- With over 35,000 museums, the U.S. boasts the most cultural institutions globally.
Languages research
Most common languages spoken a home other than English or Spanish
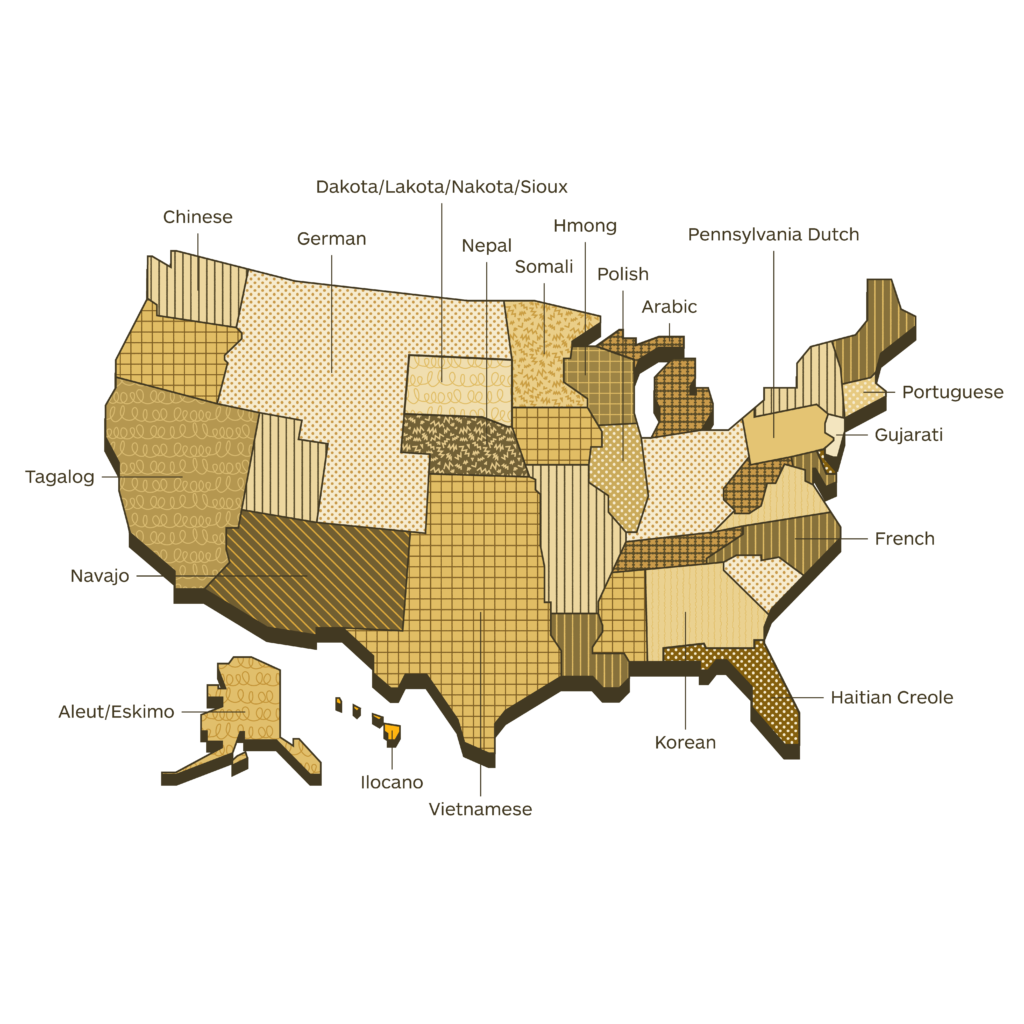
Legend
-
German
-
Vietnamese
-
Chinese
-
Navajo
-
Korean
-
Nepal
-
Dakota/Lakota/Nakota/Sioux
-
Somali
-
Arabic
-
French
-
Tagalog
-
Polish
-
Hmong
-
Pennsylvania Dutch
-
Portuguese
-
Haitian Creole
-
Gujarati
-
Aleut/Eskimo
-
Ilocano
Most commonly spoken languages other than English
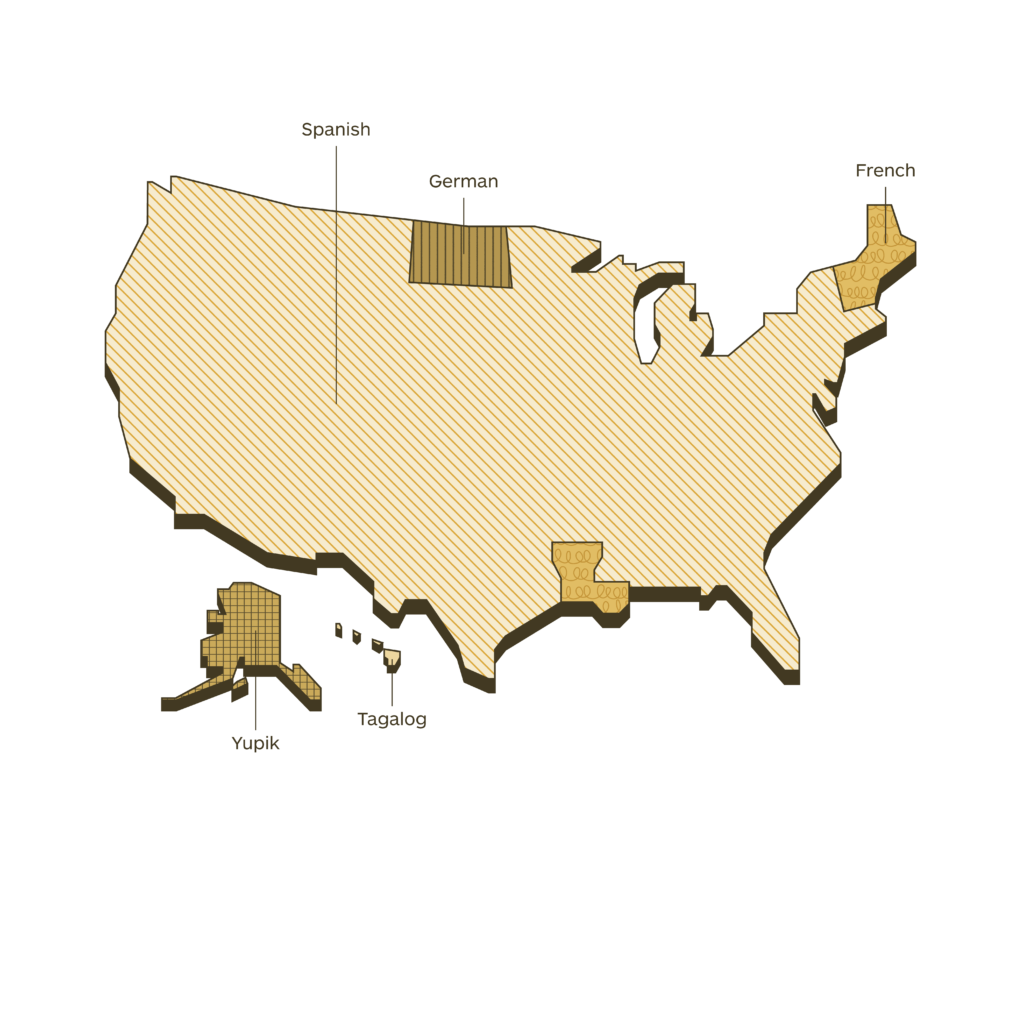
Legend
-
Spanish
-
German
-
French
-
Yupik
-
Tagalog
The geographical distribution of languages that you will find in the maps published in this section is a work in progress. Our community is helping us to fill it up with always new and updated data. Your contribution is precious. If you want to help us, please write to imminent.factbook@translated.com
Photo credit: Nirmal Rajendharkumar, Unsplash