
Localization
It has become quite evident that digital businesses are the present and the future of global trade.
The T-Index is a tool to identify the best markets in which to localize digital businesses. But what trends does the T-Index reveal?
This article will further analyze these trends, which are then reflected in the localization industry.
From an initial glance at the T-Index, there are a few statistics that are clear. Firstly, English, with a T-Index rate of 35.7%, is still the most “influential” language when it comes to expanding a business. However, this linguistic hegemony is being challenged by the rise of other languages, not just in terms of their spoken usage but through their entry into educational systems and their increasing digital presence.
It is important to realize that not all languages have the luxury of having language corpora online. This number is constantly growing, but not all languages are currently supported by online infrastructures such as Google, even though they are widely spoken in their home country. This means that a significant segment of the internet population adapts to using a different language (most often English) online or simply does not have access to the internet.

oXXIgen
Imminent Research Report 2022
GET INSPIRED with articles, research reports and country insights – created by our multicultural interdisciplinary community of experts with the common desire to look to the future.
Get your copy nowThe rising global internet penetration rate has strongly contributed to the growth of local languages online. Another factor that cannot be ignored is the effect of the Covid-19 pandemic, which substantially accelerated this process as the world quickly needed to move most of its life online.
A further factor that must be considered is that a country’s official language often does not represent the majority of its population. There are two main causes of this phenomenon. The first is historic: many countries that used to be colonies have maintained strong economic and political ties with the colonizing country and thus have also kept its language. In countries such as India, Nigeria, Rwanda, Ghana, Eritrea and many others, local languages are challenging the status of English and French as dominant languages and are emerging online. Languages such as Hausa, Igbo, Yoruba, Tamil, Sesotho, Tigrinya, Telugu, Bengali, Hindi, Akan, Kinyarwanda and many more were always more popular than colonial languages, but as they gain more presence online, their importance for businesses grows.
The development of online corpora for these languages can lead us to an obvious yet crucial conclusion: internet users prefer to look for content, shop online, and use the internet in their own language.
The second factor that strongly influences linguistic matters in every country is migration. Each country has its own linguistic panorama, but some are more complex than others. The T-Index takes this into account. The physical migration of communities also entails the migration of internet users. There was a time when migrating meant leaving one’s country of origin completely, entering a new society and learning a new language. Today, the internet allows people to keep their relationship with their country of origin alive and to continue to speak their own language.
A glaring example of this phenomenon can be seen in the United Arab Emirates, where more than 40% of the population is Indian and thus prefers to use their native language when on the internet rather than the UAE’s official language (Arabic) or English. Another important example can be seen in the United States, where due to migratory flows a significant portion of the population (13%) uses Spanish online.
As a consequence of these considerations, 47 countries out of 202 were “updated” in this new version of the T-Index, and many more will need to be changed in the coming years as more languages start to be used with frequency online.
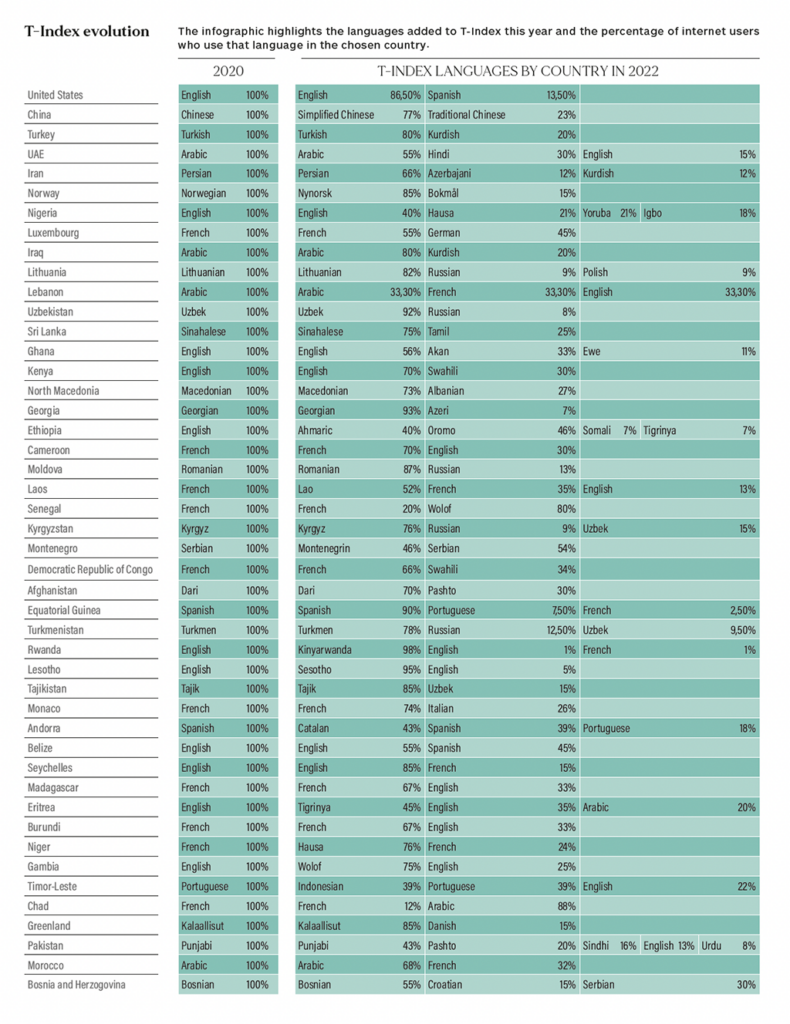
The following infographic highlights the languages added to the T-Index this year and the percentage of internet users who use that language in the chosen country.
Only two cases – China and Norway – are highlighted in yellow, where the terms Chinese and Norwegian did not properly represent the four linguistic variations present online.
Languages are not stable: they keep moving and bouncing around the world, some evolve, some mix, some die. The T-Index joins the dots, places languages where they are geographically and measures their impact on online trade; it evolves as markets are affected by language.
Export and import markets
The T-Index portrays statistics related to the imports and exports of more than 1800 products and services. It allows users to develop a greater understanding of specific markets and to discover import and export routes and demography. While some of these are obvious, others are quite rooted in history, and some are “unusual”. Furthermore, what is important to understand is that there are many individual factors that affect the different markets in a number of different ways.
Firstly, it is important to highlight that looking at exports and imports shows us how two countries stand out above all others: China and the United States.
China leads the global export ranking with more than $2.723 trillion, followed by the US with $2.134 trillion. China is the common denominator of partners when it comes to exports: it has strong trade ties with the European Union, Russia, Japan, the United States, and the ASEAN market, and it dominates the product export market, as it trades all sorts of products with its partners.
The two economies switch places when it comes to the import sector, with the US importing $2.40 trillion of goods per year, ahead of China with $2.05 trillion.
An example of this is the $2.2 billion of bed, table, bathroom, and kitchen linen imported from China by the United States. Many products have China and the United States as the leading exporters and importers due to the large-scale production of goods characteristic of China and the great consumerism that characterizes both the US and China.
But browsing the T-Index also reveals other facts that are less obvious.
Not all exports are dominated by China: some have different outcomes and are led by other countries. For example, the global trade in dishwashers is dominated by Germany. The United States imports $933 million, France imports $438 million and China closes out the top three with $420 million of dishwashers from the European powerhouse, which exports 3.9 trillion to its top ten trading partners and reaches geographically distant countries such as Australia and New Zealand (which import an aggregate of $185 million).
Another “unusual” market here can be seen in Saudi Arabia, which imports 30% of the live goats and sheep on the market for a total of $435 million.
Another aspect that comes across as evident is the predominant position held by the United States and Russia in the oil market. The United States exports more than $17 billion to its top five partners alone (Japan, Mexico, South Korea, Canada, China). Before the outbreak of the Ukraine crisis, Russia also exported the same amount ($17 billion) to its top six partners: Italy, Japan, Belarus, Czechia, Slovakia and Hungary.
An interesting market is pharmaceutical goods. Localization is fundamental for pharmaceuticals, explaining why languages that are similar or countries that share linguistic and cultural proximity have a higher T-Index for these products. An example of this can be seen in Scandinavia, where the main importers of pharmaceutical goods from Sweden are Denmark ($7.8 million), Finland ($10 million) and Norway ($8.9 million). A similar case can be seen with pharmaceutical goods exported from Portugal, where Spain, Mozambique and Angola are among the top five importers.
Something else that emerges from the T-Index is the importance of trade and political agreements. For example, when looking at imports in France and selecting T-shirts as a product, only 2 of the top 10 trade partners are outside the European Union, and one of these is the United Kingdom, which still has strong economic ties to the EU. The total imports of these 8 countries facilitated by European trade agreements amount to $575 million.
It is also noticeable how some markets remain niche. For example, Switzerland remains the leader (with China) in exports of clocks and watch parts, and the same goes for Italy for exports of pasta. When looking at the countries that import these products, there are some peculiarities. Saudi Arabia’s imports of Italy’s traditional food have reached $16 million, making the country the second fastest growing importer behind the United States.
On the other hand, when looking at imports of clocks and watch parts, the paradox is that the biggest importer in the market is Switzerland itself with $213 million.
When it comes to the food industry, global trade adapts to the possibilities offered by each country. For example, Brazil is the biggest exporter of poultry meat, exporting more than $1 billion worth of poultry to China. Norway is one of the leading countries in exports of fish products, and New Zealand is the top exporter in the milk and cream market.
The T-Index gives its users the opportunity to better understand where their products or services can serve a purpose and are needed, and in which languages to localize when targeting a specific market.

Enrico Boscardi
Project Manager Social Impact at Translated
Enrico has an undergraduate degree in International Studies and a master’s degree in Corporate Communication and Marketing. He currently supports project management for Imminent, particularly overseeing research projects and the content produced from them, ensuring smooth coordination and high-quality delivery across the team.
Photo credits: Luca Bravo, Unsplash