
Localization
The T-Index is an innovative metric that quantifies the online sales potential of over 5,000 products for more than 150 countries, consequently allowing users to assess the cost-effectiveness of translating communications and the corresponding advertising into the specific languages of these countries. In particular, this study aims to provide an indicator that allows users to choose the best markets and the optimal languages in which to invest. For this purpose, we have combined highly specific import data with data on the percentage of internet users and on income distribution in each country, using techniques and methods developed as part of the Science of Complexity. This gives us an overview with an unprecedented level of detail, illustrating the countries with the greatest e-commerce potential for each product.
The Science of Complexity
The science of complexity [Pietronero 2008] is a new scientific field that complements reductionism and focuses on the relations and interactions between the elements in a system. A complex system is characterised by emerging properties that cannot be deduced from its individual elements. For example, it would be very difficult to understand why ice melts or why life emerges in a cell on the basis of the individual properties of the molecules involved.
The dynamics of economics are the result of the interaction of many elements: people, companies, countries, institutions. These undoubtedly interact with one another and therefore constitute a complex system and a natural field of application for the science of complexity. This is the approach that we consider in constructing Economic Fitness and Complexity [Tacchella 2012], an innovative and interdisciplinary field that uses methods from physics, complex networks and machine learning to study economics. A comparable approach can be found in the paradigm shift introduced by Google’s PageRank algorithm, which focuses on the link between websites rather than the detailed properties of each individual site. In a similar way, we focus on the exports of products rather than on a detailed analysis of the properties of individual nations. In both cases, the idea is to find both data that summarises the information we want, and an algorithm to extract this information. However, the similarities end there: PageRank may inspire a certain approach, but new data, algorithms and ideas are required to study economics.
Furthermore, the approach is inspired by the methodologies of the physical sciences when it comes to scientific rigour in empirical testing. This approach, which involves detailed and quantitative “experiments”, is rare in economics, which prefers to place different models “horizontally” rather than comparing them. In many cases, the resulting analysis is conditioned by ideological prejudices, and it is rare to find explicit falsifications of the various theories available.
With Economic Fitness and Complexity (EFC), however, we intend to scientifically test all our results and methodologies. For example, our methods based on the physics of dynamic systems are capable of providing better country growth forecasts than those supplied by the International Monetary Fund, despite (or probably thanks to) using much less data for the analysis [Tacchella 2018]. In addition, the networks or product spaces we construct
are statistically validated against non-trivial null models that take into account both the diversification of countries and the ubiquity of the products they export [Zaccaria 2014, Pugliese 2019].
In the following analysis, we will use the very same scientific approach – and much of the same data – as EFC. However, the aim will not be to assess a country’s growth potential or its pathway in the product space, but rather to identify the geographical and cultural proximity between countries and to use this information to construct a new version of the T-Index that helps highlight the best market for each exporter: what to sell and where to sell it.
The T-Index
Trade in physical products is affected significantly by transport costs and by the existence of trade agreements between countries. Moreover, each nation has particular characteristics that are difficult to take into consideration as part of an aggregate analysis. For this reason, in order to identify the best markets on which to focus, it is necessary to develop a highly detailed approach that takes into account the geographical and cultural proximity of the intended target country as well as its peculiarities. For example, although Saudi Arabia has a very high GDP per capita, it would be unthinkable to target this nation if selling winter coats. Given the low cost of fuel and the local lifestyle, meanwhile, the country would be a thriving market for anyone intending to export high-powered cars. Similarly, although China is a market with huge scope, for a company based in Germany, France turns out to be a better commercial partner thanks to its geographical and cultural proximity and the fact that both of these nations are part of the European Union.
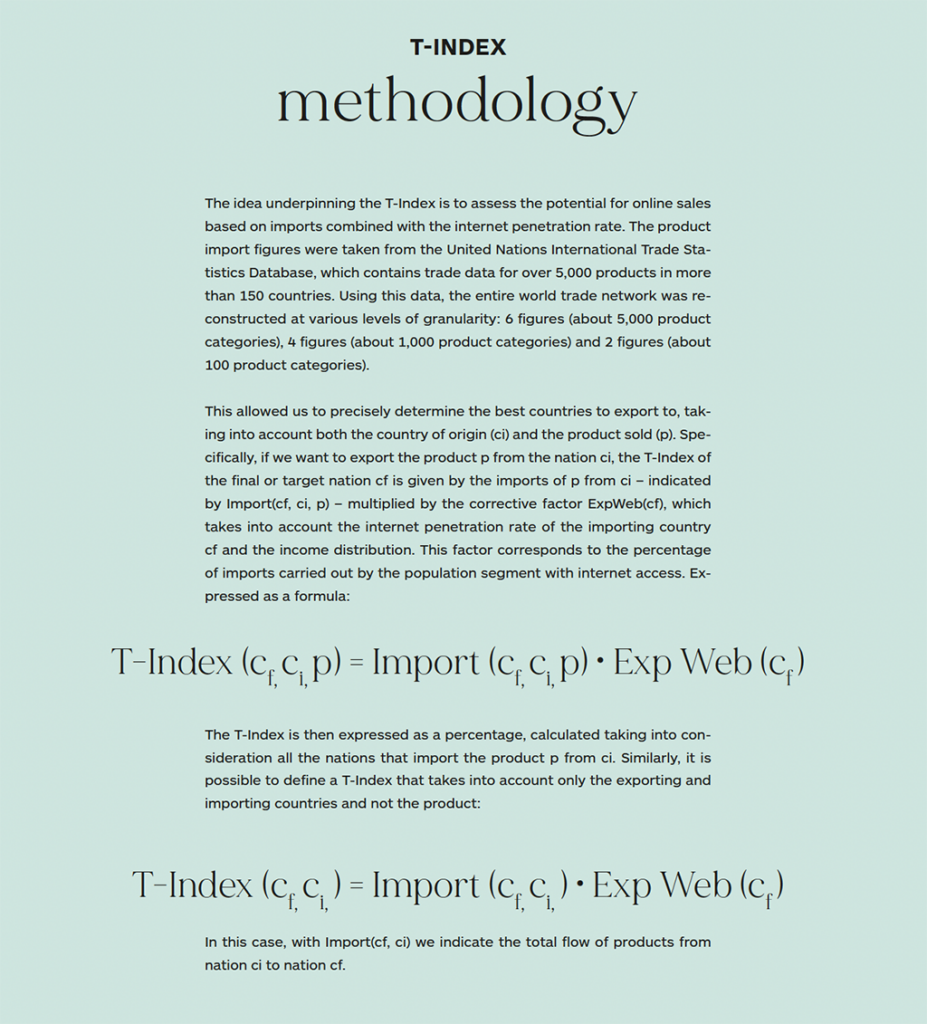
Clearly, it is very difficult to analyse the socioeconomic and cultural characteristics of intended target countries on a case-by-case basis, especially if we want to carry out an analysis that also takes into account the product being sold. It is therefore necessary to follow a data-driven and automated approach that allows us to take all these factors into consideration. To this end, we analysed the entire international trade network so as to determine the import/export flows of over 5,000 different products between more than 150 countries. This type of data contains within it all the information about the existence of trade agreements, the geographical and cultural proximity and the particularities of the various countries, and it therefore allows us to develop highly personalised investment strategies. Other elements to consider are the internet penetration rate and the average wealth of the potential buyer. These three sources of information have been combined to build two different metrics: the nation-specific T-Index, which takes into account the nation to which we want to export, and the product-specific T-Index, which allows us to consider both the exporting country and the exported product. The calculation procedure is explained in detail in the box below.
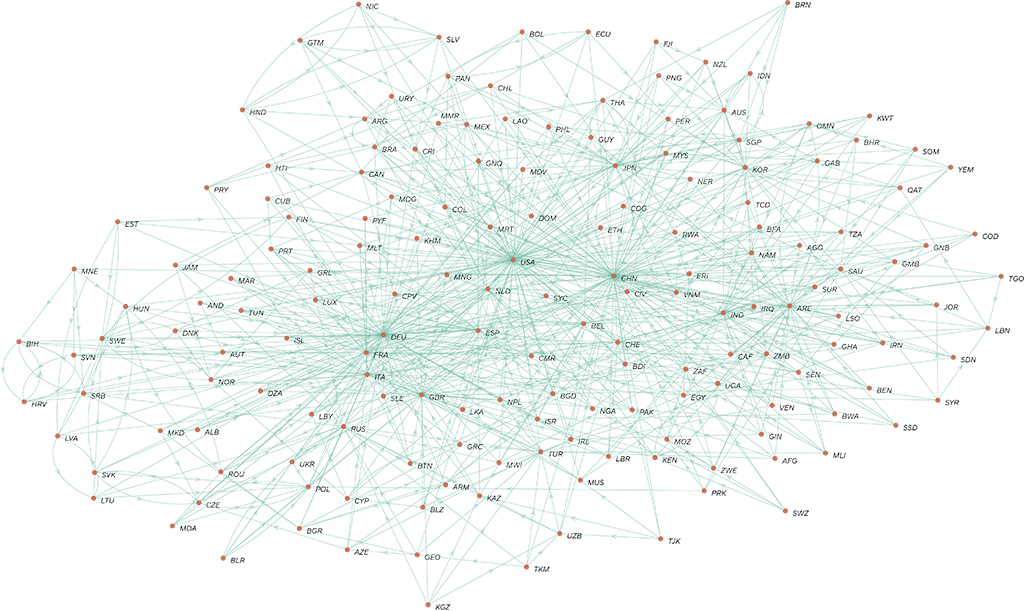
The network of the nation-specific T-Index is represented in Figure 1. For each exporting nation, we selected the five countries with the highest T-Index value and connected them to the exporting nation with a direct link. This network provides a general picture of global trade. For example, we can see that the United States is the most central and connected nation, which means that (on average) it is the best market on which to focus. China also occupies a rather central position, but its connections are primarily with Asian and African nations. On the left, we find most of the European states, which are very interconnected and close: this implies that, for European nations, the most significant market is generally the European market (in addition to the United States). We also note how the trio of Germany-France-Italy dominates this market. Other groupings of countries highlighted by the network are the South American countries (top centre), which are very connected between themselves and with the United States, and the countries that produce raw materials (on the right).
Table 1, meanwhile, lists some examples of the product-specific T-Index for different exporting countries and products. From the point of view of Italy and Germany, the United States and the other European nations are the best commercial partners, while China only appears sporadically despite being an enormous market. The USA presents a different and more heterogenous picture, with the product-specific T-Index highlighting how the optimal markets can be either European, Asian or African countries. This further confirms the central position of the United States in the global trade network. Once again in this case, China – which would be in second place based on an aggregate analysis – plays a secondary role, surpassed by nations with a much smaller population and GDP.
| Germany | Germany | USA | USA | Italy |
| vehicles | shoes | pharmaceuticals | cereals | beverages |
| USA 11.9% | Switzerland 11.8% | Germany 14.5% | Japan 21.1% | USA 23.7% |
| UK 10.6% | France 11.3% | Netherlands 8.6% | Mexico 20.4% | Germany 14.6% |
| China 10.3% | Poland 10.6% | Belgium 8.4% | South Korea 9.9% | UK 12% |
| France 7.2% | UK 8.8% | Japan 7.6% | Colombia 5.4% | Switzerland 5.8% |
| Italy 5% | Netherlands 8.3% | Canada 7.3% | China 3.9% | France 5.5% |
Future developments
Economic Fitness and emerging nations
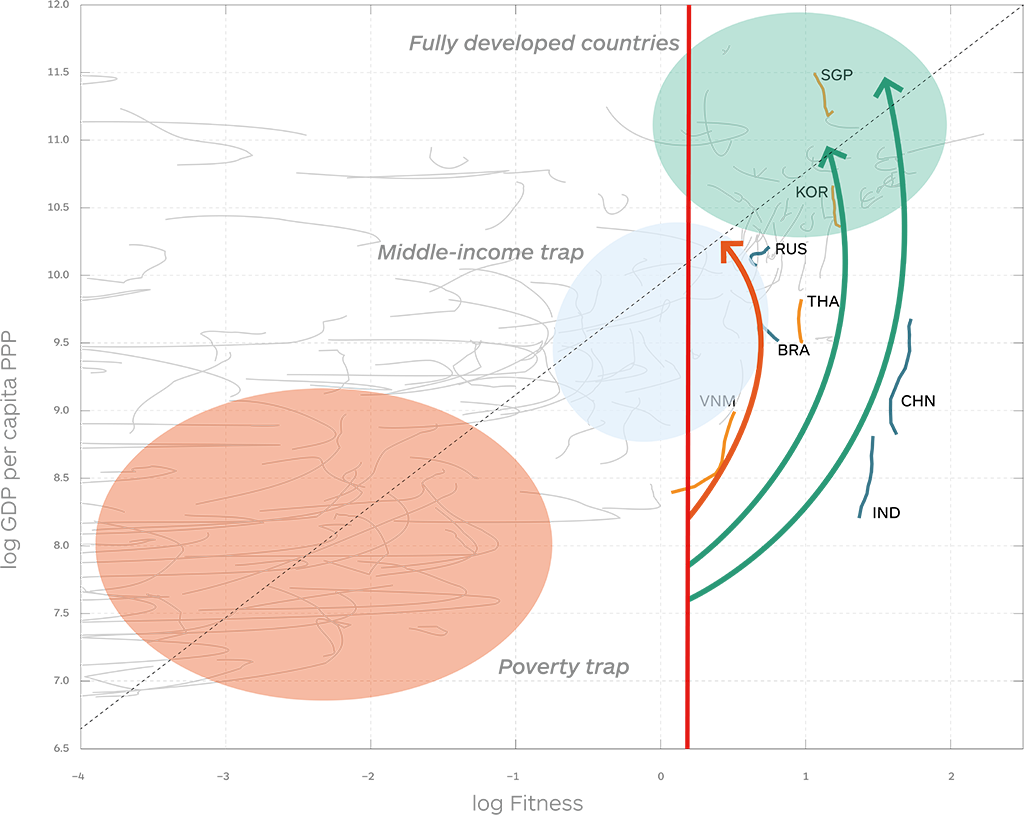
The methodology known as Economic Fitness and Complexity, recently developed by a group of physicists from the Sapienza University of Rome, the Institute for Complex Systems (National Research Council of Italy) and the Enrico Fermi Research Center (CREF), aims to offer a quantitative and scientifically valid macroeconomics methodology. The approach is data-driven and highly multidisciplinary, combining models and methods from statistical mechanics, the physics of systems and complex networks, data science, and machine learning. This methodology was officially applied by the World Bank and the European Commission for their studies on the industrial and technological development of countries. One of the most significant results of the Economic Fitness approach is its success in providing a very accurate medium and long-term forecast of the GDP of countries. As testified by an article in Bloomberg Views (www.bloomberg.com/opinion/articles/2017-10-01/a-better-way-to-make-economic-forecasts), these predictions are better than those provided by the International Monetary Fund. This data
allows us to evaluate the development potential of nations over a wider time span, and consequently to consider the potential benefits of translating into the languages of emerging countries.
Machine learning to forecast the markets of the future
Economic Fitness and Complexity allows us to identify the emerging countries with the greatest likelihood of development, but also to indicate which specific products these countries will begin importing in the future. Thanks to over 25 years of historical data on the trade flows between nations, it is possible to identify recurring patterns in the development trajectories of countries and therefore to understand which products these countries will start to import. This problem is similar to the issue of predicting future exports, i.e. understanding when a nation will start exporting a certain product for the first time. In this context, the approach that proves to have the best predictive power is based on machine learning algorithms such as the random forest algorithms [Albora 2021], which can also be used to determine when a nation will start importing a specific product for the first time. Using this approach, it will be possible not only to identify the emerging nations, but also to find out which internal markets they are most likely to develop. This allows us to plan out suitable sales strategies in advance, such as translating a website into the most appropriate languages.
Identifying existing opportunities with the theory of networks
Through Economic Fitness and machine learning techniques, it is possible to predict the markets that will develop in the future. However, it is also important to consider the opportunities that are out there today but that have not yet been fully exploited. With the theory of networks, we can identify these opportunities using an objective and totally data-driven approach. Firstly, we must use measurements of similarity to identify, for each country, which are the most similar nations in terms of exports. This information then allows us to understand if there are foreign markets – currently dominated by other nations – that offer realistic opportunities for expansion. In other words, if we observe that many nations similar to the intended exporter country are able to sell a certain product in a specific nation, it is likely that the country in question can enter that market if armed with a suitable business strategy.
Bibliography
Albora, G., Pietronero, L., Tacchella, A., & Zaccaria, A. Product Progression: a machine learning approach to forecasting industrial upgrading. arXiv preprint arXiv:2105.15018. (2021).
Pietronero, L. Complexity ideas from condensed matter and statistical physics.
Europhysics News, 39(6), 26-29. (2008).
Pugliese, E., Cimini, G., Patelli, A., Zaccaria, A., Pietronero, L., & Gabrielli, A. Unfolding the innovation system for the development of countries: coevolution of Science, Technology and Production. Scientific Reports, 9(1), 1-12. (2019).
Tacchella, A., Cristelli, M., Caldarelli, G., Gabrielli, A., & Pietronero, L. A new metrics for countries’ fitness and products’ complexity. Scientific Reports, 2(1), 1-7. (2012).
Tacchella, A., Mazzilli, D., & Pietronero, L. A dynamical systems approach to gross domestic product forecasting. Nature Physics, 14(8), 861-865. (2018).
Zaccaria, A., Cristelli, M., Tacchella, A., & Pietronero, L. (2014). How the taxonomy of products drives the economic development of countries. PLOS ONE, 9(12), e113770.
Photo credits: Nataliya Vaitkevich, Unsplash