
Localization
T-Index of languages: what it is, how it is calculated, and why it’s so relevant for businesses? Some answers by Professor Luciano Pietronero, who teaches at the Physics Department of “Sapienza” University of Rome. He is also President of the Enrico Fermi Research Center and Senior Advisor of IFC-World Bank of Washington.
The T-Index is an innovative metric that quantifies the online sales potential of over 5,000 products and services for more than 100 countries, consequently allowing users to assess the advantages of translating communications and the corresponding advertising into their specific languages. In particular, this study aims to provide an indicator that allows users to choose the best markets and the optimal languages in which to invest. For this purpose, we have considered online sales of services and products separately, combining highly specific import data with the percentage of internet users per country. This gives us an overview with an unprecedented level of detail, illustrating the countries with the greatest e-commerce potential for each product and service.
One thing is clear: when choosing which countries to focus on, the type of product or service sold plays a significant role, as different countries have different needs and quirks. Furthermore, while services can often be exported with no transport costs thanks to the internet, the buying and selling of products is affected by the distance between countries and the existence of trade agreements. As a result, although they may sell the same product, two companies based in different countries will find themselves having to focus on different markets.

Imminent Annual Report 2021
Fit your business in global shape. Get your copy of Imminent Annual Research Report 2021. And let us know what you think.
Get your copy nowIn addition to the T-Index, which allows us to determine the current potential of various languages for each product, we also used the Economic Fitness algorithm to help understand which emerging nations will dominate the online sales marketplace in the coming years. This method, developed by a group headed by Professor Luciano Pietronero of the Department of Physics at the Sapienza University of Rome and the Institute for Complex Systems of the National Research Council of Italy, is currently used by the World Bank and the European Commission. It provides precise estimates on the medium to long-term growth of countries’ GDP, starting from a quantitative assessment of their current level of industrial development.
Below is a description of the methods and results of our approach, taking into account the heterogeneous nature of the source and the characteristics of the data used.

T-Index for Services
With regard to services, we analysed the 12 classes identified by the International Monetary Fund (IMF), shown in Table 1. For each of the services analysed, this table also indicates the countries with the greatest potential for sales and the corresponding T-Index value. Globally, the United States comes out on top as the country with the greatest potential for online service sales, ranking first in four different categories: Government Services; Insurance and Pensions; Personal, Cultural, and Recreational Services; Transport. Next is Germany, ranking first in Telecommunications, Computer, and Information Services and Maintenance and Repair Services. Also among the nations with the greatest potential are Japan (Construction), France (Manufacturing Services on Physical Inputs Owned by Others) and China (Travel).
In all likelihood, the presence of Ireland and Luxembourg in the list stems from the tax laws of these countries, which have attracted a large number of overseas companies. When it comes to the services sector, then, the United States is still a way ahead of China, even though the latter accounts for almost triple the number of internet users, making China the world leader by this metric. It is also interesting to note the enormous gap between many of these countries and China with regard to population. This demonstrates that, in the tertiary sector, population size plays only a limited role in determining online sales potential.
| Service | Leading Country | T-Index |
|---|---|---|
| Other Business Services | Ireland | 16% |
| Telecommunications, Computer, and Information Services | Germany | 15% |
| Construction | Japan | 18% |
| Financial Services | Luxembourg | 21% |
| Government Services | United States | 44% |
| Insurance and Pensions | United States | 32% |
| Charges for the Use of Intellectual Property | Ireland | 29% |
| Maintenance and Repair Services | Germany | 23% |
| Manufacturing Services on Physical Inputs Owned by Others | France | 22% |
| Personal, Cultural, and Recreational Services | United States | 28% |
| Transport | United States | 13% |
| Travel | China | 19% |
T-Index for services: methodology
The idea underpinning our approach is that the value of a nation’s imports and of a given product contains the essential information on the needs of that country, the purchasing power of its citizens, the presence of cultural factors, and so on. Figures for imports of services were obtained using the Balance of Payments (BoP) provided by the International Monetary Fund, which allows us to analyse imports of twelve categories of services for 127 countries. The T-Index is defined as the import of the service in question (s) multiplied by a factor that takes into account the internet penetration rate of the importing country (cf) and its income distribution.
T-Index(cf,s) = Import(cf,s) x ExpWeb(cf)
More specifically, ExpWeb(cf) is the percentage of imports made by the population group with internet access, while Import(cf, s) is the import of the services made by the nation cf. To make it easier to interpret, this quantity is then expressed as a percentage, obtained by dividing the T-Index by the sum of the T-Index values of the other countries (in relation to the service in question).

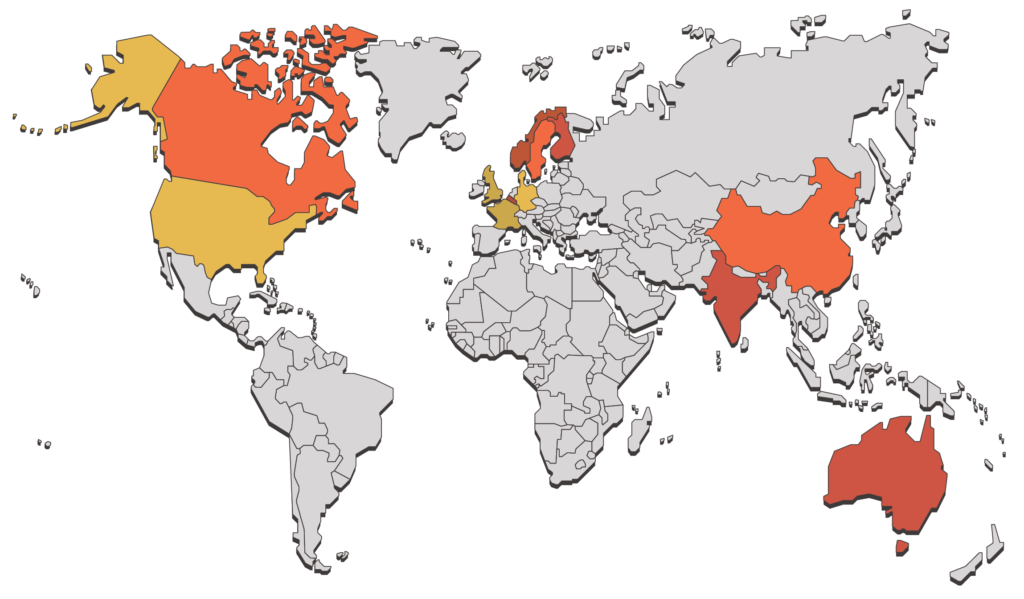
The world through the eyes of the T-Index
The maps show the 15 countries with the highest T-Index values for two different services: ‘Personal, Cultural, and Recreational Services’ and ‘Travel’. The country with the highest T-Index is in light yellow, with the fifteenth in red. As we can see, the two maps differ significantly, proving that the online sales potential of a country (or a language) depends heavily on the service intended for export.
Travel
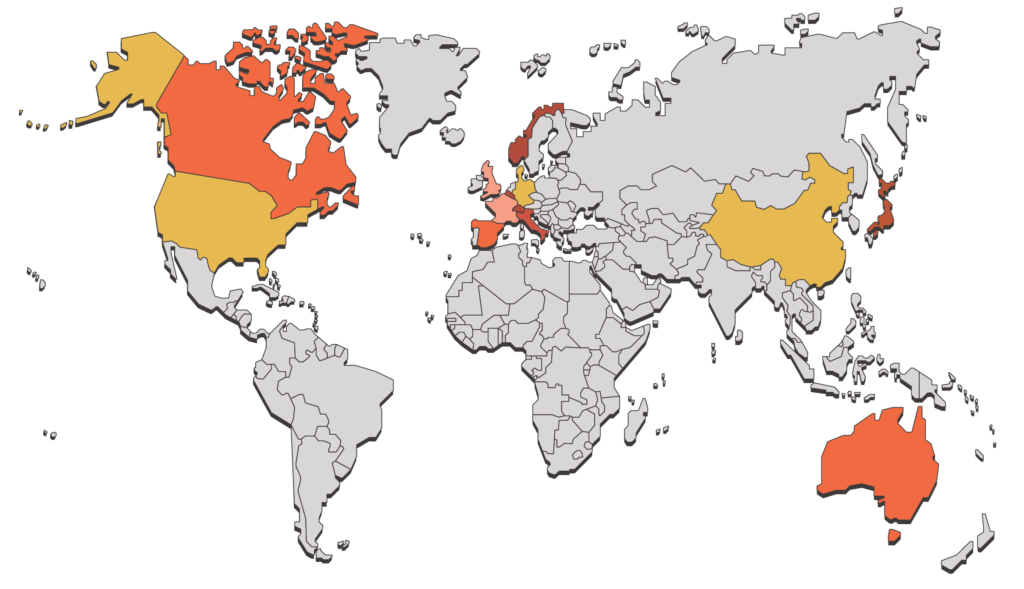
Personal, Cultural, and Recreational Services
T-Index for Products
Compared to the trade in services, trade in physical products is affected much more significantly by transport costs and the existence of trade agreements. In the case of products, therefore, a detailed analysis must be developed that not only expresses a specific T-Index value for the product and the importing country, but that also considers the country from which one wants to export the product. To this end, we analysed the entire international trade network so as to determine the import/export flows of over 5,000 products between more than 150 countries. This allows for the development of highly customised investment strategies. For example, take an Italian company that produces ceramic items: the top five countries for imports of ceramic items from Italy are Germany, China, Spain, France and Denmark, and these will therefore be the main markets to focus on.
On the other hand, if the same items are being exported from Japan rather than Italy, the best trading partners will be China, the United States, Vietnam, Italy and Thailand. It therefore becomes clear that changing the country of origin also changes the countries in which we should invest and thus the languages upon which it is advisable to focus. A similar argument applies if we consider two companies based in the same country, but exporting different products. For example, the main trading partners for an Italian company that produces fertiliser will be Egypt, Germany, Russia, Belarus and Spain.
Imminent Annual Report 2021
Fit your business in global shape. Get your copy of Imminent Annual Research Report 2021. And let us know what you think.
Get your copy nowT-Index for products: methodology
Again, the idea underpinning our approach is to use imports combined with the internet penetration rate to establish the potential for online sales. The product import figures were taken from the United Nations International Trade Statistics Database, which contains trade data for over 5,000 products in more than 150 countries. Using this data, the entire world trade network was reconstructed at various levels of granularity: 6 figures (about 5,000 product categories), 4 figures (about 1,000 product categories), and 2 figures (about 100 product categories). This allowed us to precisely determine the best countries to export to, taking into account both the country of origin (ci) and the product sold (p). Specifically, if we want to export the product p from the nation ci, the T-Index of the nation cf is given by the imports of p from ci (Import(cf, ci, p)) multiplied by the same corrective factor used for services.
T-Index(cf,ci,p) = Import(cf,ci,p) x ExpWeb(cf)
The T-Index is then expressed as a percentage, calculated taking into consideration all countries that import the product p from ci. Similarly, it is possible to define a T-Index that takes into account only the exporting and importing countries and not the product, as so:
T-Index(cf,ci) = Import(cf,ci) x ExpWeb(cf)
In this case, with Import(cf, ci) we have indicated the total flow of products from nation ci to nation cf.
| Exporting country | Product | First choice | Second choice | Third choice |
|---|---|---|---|---|
| Italy | Ships, boats and floating structures | USA (23%) | GBR (17%) | DEU (15%) |
| Italy | Cotton | TUR (24%) | CHN (17%) | EGY (6%) |
| China | Cotton | VNM (24%) | USA (17%) | AUS (15%) |
| China | Fertilisers | CAN (28%) | RUS (16%) | ISR (15%) |
| United States | Fertilisers | CAN (48%) | RUS (13%) | MAR (8%) |
| United States | Tobacco and manufactured tobacco substitutes | DOM (36%) | CAN (11%) | BRA (10%) |
| Vietnam | Organic chemicals | CHN (34%) | KOR (14%) | SGP (12%) |
| Qatar | Mineral fuels, mineral oils and products of their distillation | IRN (20%) | USA (19%) | CHN (13%) |
| Japan | Photographic or cinematographic goods | USA (41%) | CHN (20%) | KOR (15%) |
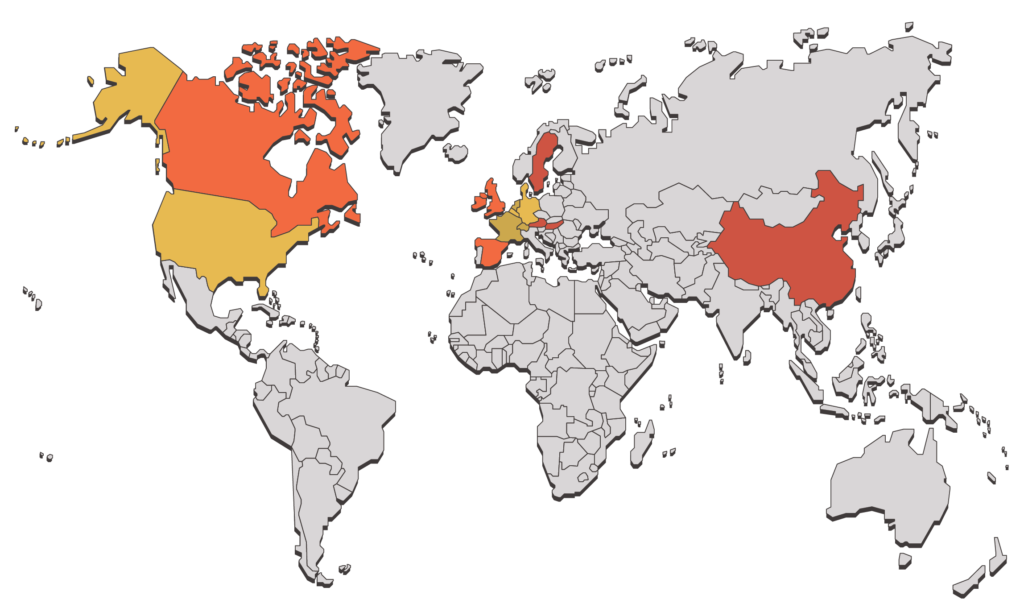
The world through the eyes of the T-Index
The map shows the 15 countries with the highest T-Index values for exporting products in the pharmaceutical sector from Italy. The country with the highest T-Index is in light yellow, with the fifteenth in red.
A glimpse into the future: Economic Fitness
The Economic Fitness methodology, recently developed by a group of physicists from the Sapienza University of Rome and the Institute for Complex Systems (National Research Council of Italy), aims to offer a quantitative and scientifically valid macroeconomics methodology. The approach is data-driven and highly multidisciplinary, combining models and methods from statistical mechanics, the physics of systems and complex networks, data science, and machine learning. This methodology was officially applied by the World Bank and the European Commission for their studies on the industrial and technological development of countries.
One of the most significant results of the Economic Fitness approach is its success in providing a very accurate medium and long-term forecast of the GDP of countries. As testified by an article in Bloomberg Views, these predictions are better than those provided by the International Monetary Fund. This data allows us to evaluate the development potential of countries over a wider time span, and consequently to consider the potential benefits of translating into the languages of emerging countries.
Imminent Annual Report 2021
Fit your business in global shape. Get your copy of Imminent Annual Research Report 2021. And let us know what you think.
Get your copy nowGDP forecasts: methodology
The GDP forecast is based on an innovative methodology that combines information on the competitiveness of countries with a predictive approach based on the physics of dynamic systems. The first step is to develop an algorithm that calculates the Fitness of countries, i.e. their industrial diversification and complexity, using their export data as a starting point. This Fitness, combined with information on the GDP dynamics of the country in question and its analogues, allows us to predict the evolution of GDP over the medium/long term. As reported in articles published in Nature Physics and Bloomberg Views, the five-year forecasts turned out to be more accurate than those produced by the International Monetary Fund.
Photo credits: Christine Roy, Unsplash / Alexander Smagin, Unsplash / Nick Monica, Unsplash